Geovisualization Projects GEOG5540

Project One
Assignment 1: Point Symbl Mapping of COVID Cases, Deaths, and percentage of population
Project Two
Classification and Colors

Project Three
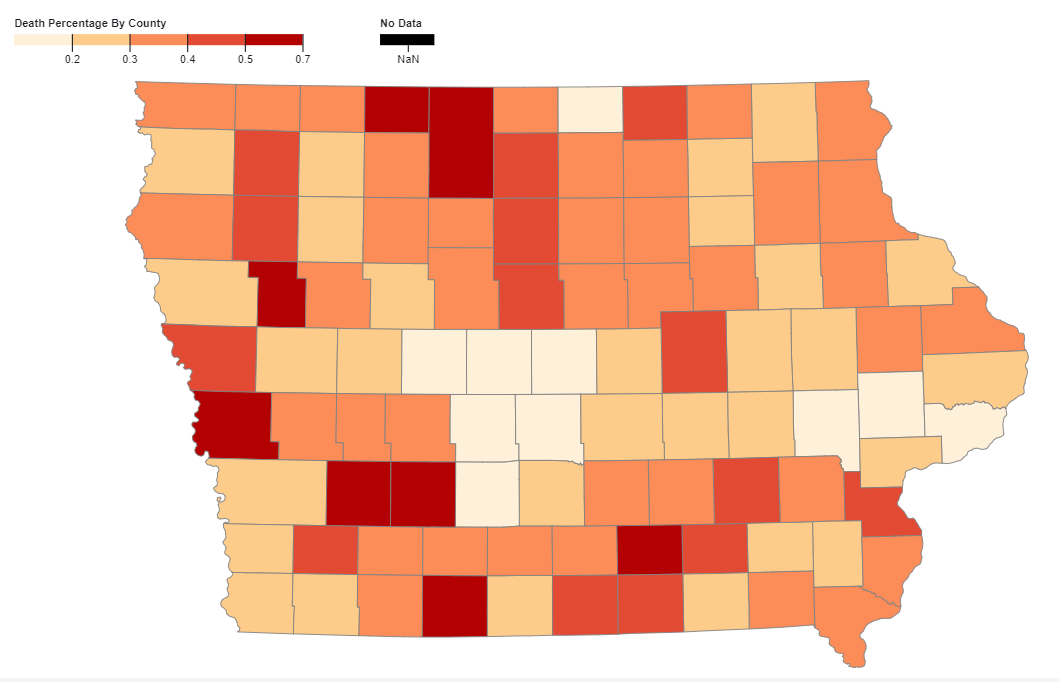
Choropleth maps of Death rates and Case rates in Iowa Counties
Project Four
Graduated Symbol Mapping

Project Five
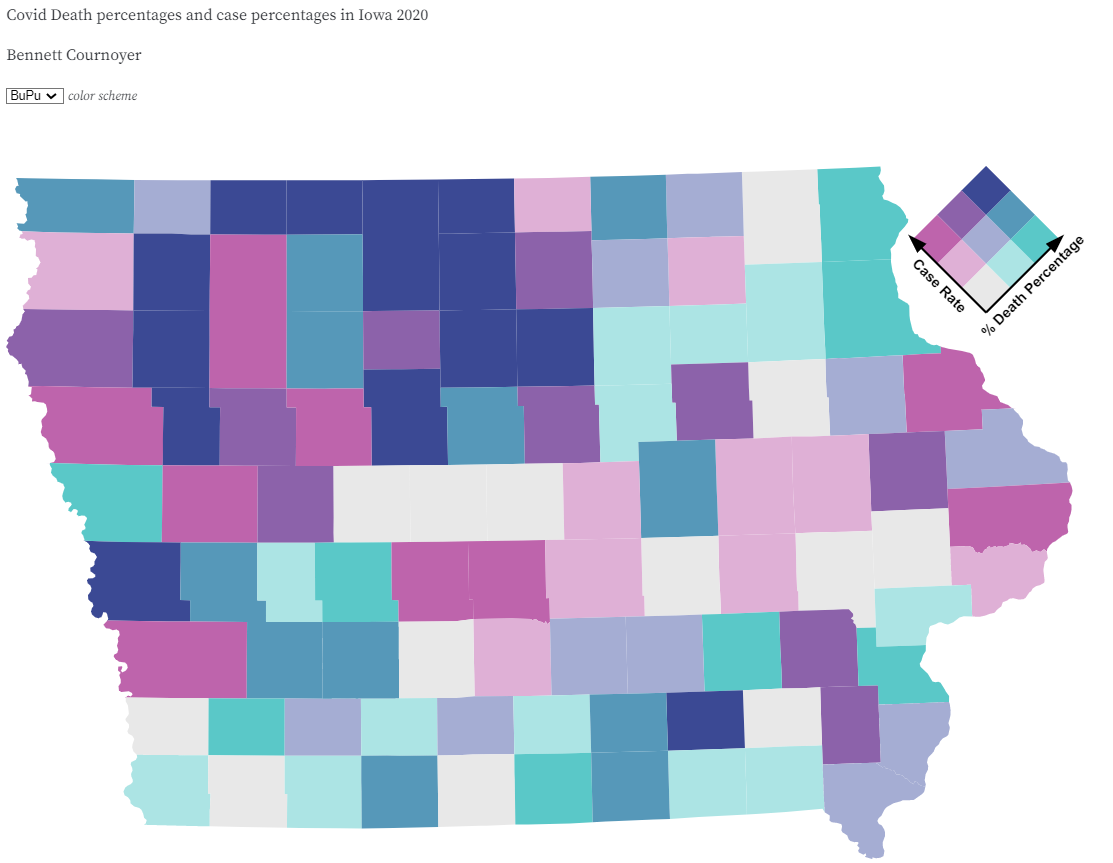
A Bivariate map of covid case rates and the death rates in Iowa.
Project Six
An Isarithmic map of rainfall in Iowa
Small Multiples
SNAP benefits in San Francisco

Flow Map Project Seven
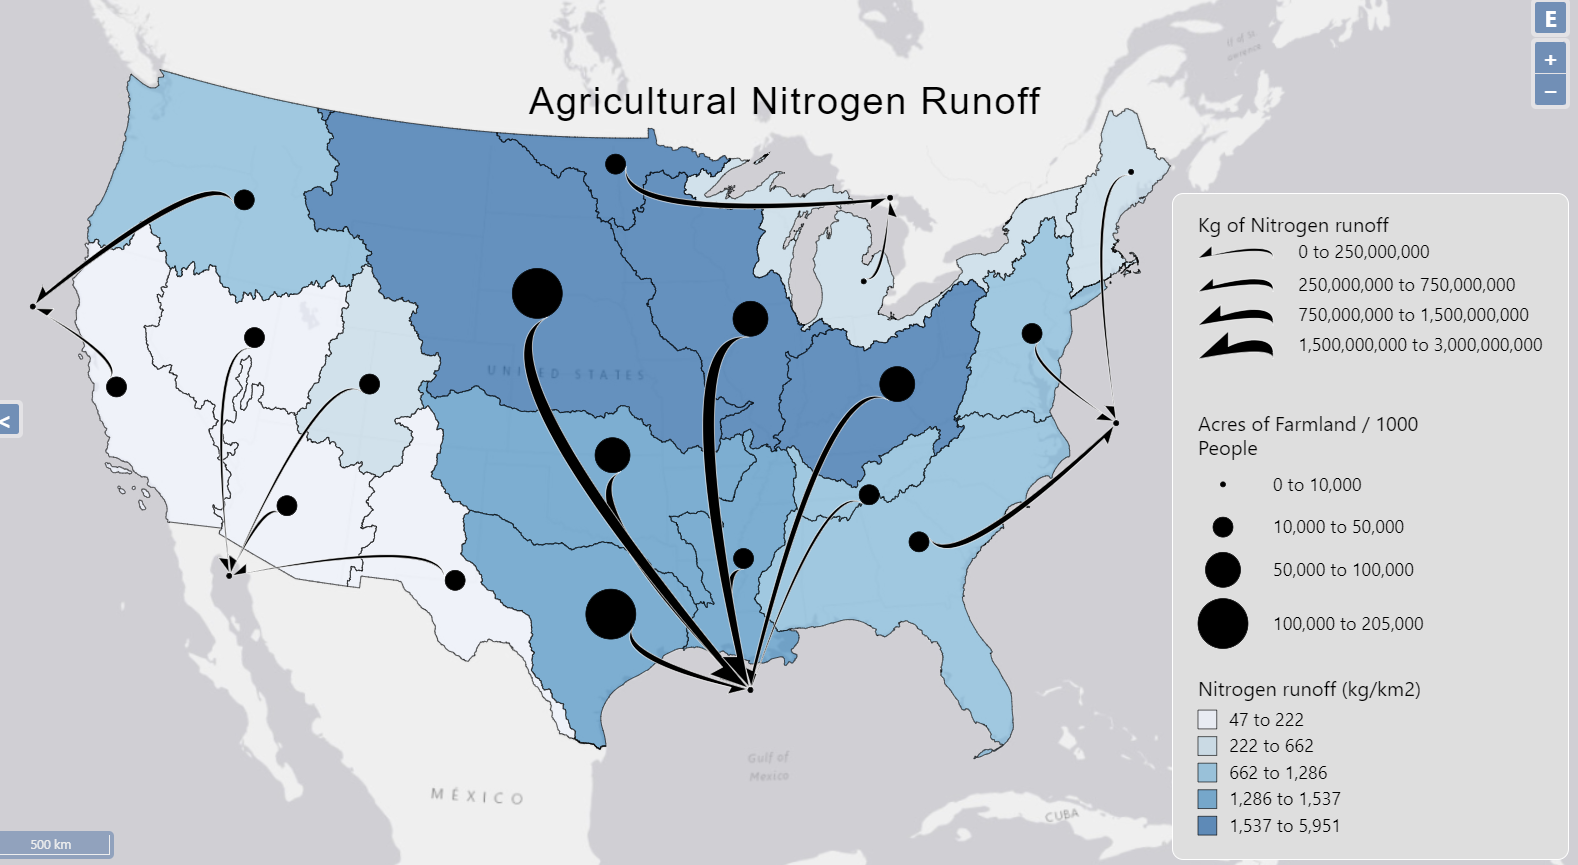
Nitrogen Runoff in the US.
Final Project
Agricultural Runoff in the US