Geovisualization Profolio GEOG:3540 Projects
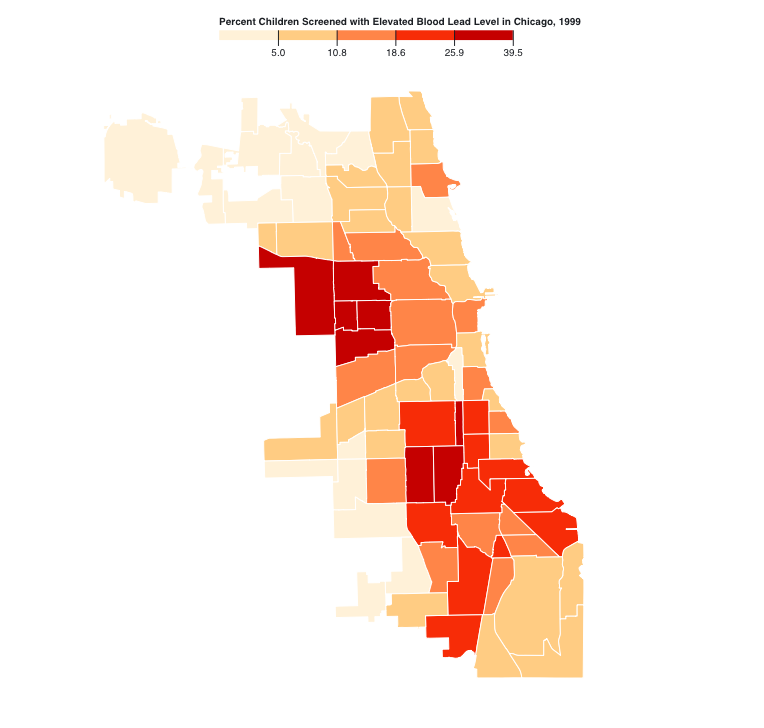
Children Lead poisoning in Chicago, 1999
This map shows the percentage of children with elevated blood lead level in Chicago community areas.

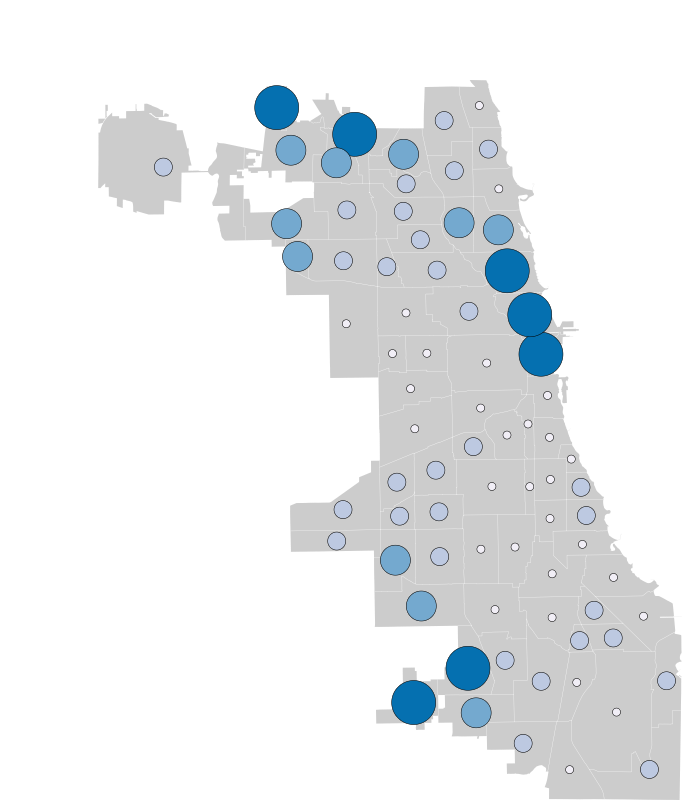
Median Income in Chicaco,1999
This map shows the median in come in Chicago community areas in 1999.
Children Lead Poisoning in Chicago, 1999 and 2013
This map shows the percentage of children with elevated blood lead level in Chicago community areas, 1999 and 2013
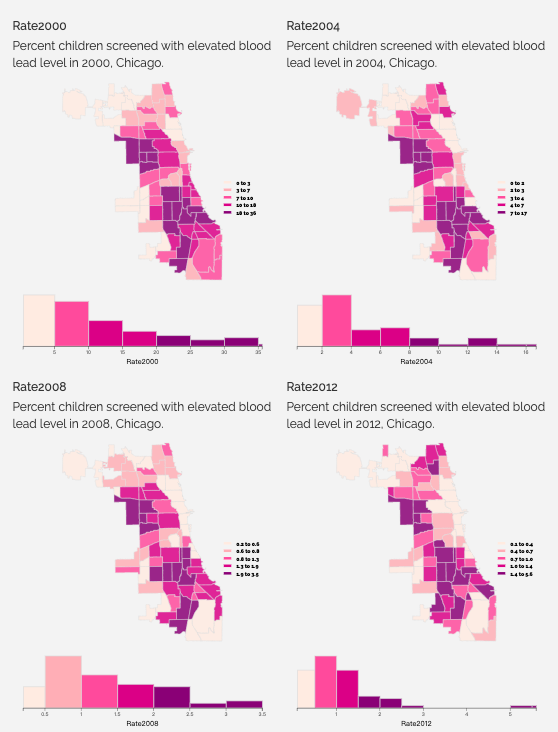
Small Multiples
This project uses small multiple maps integrated with various data classification method to show the change of lead poisioning in Chicago across space and time.
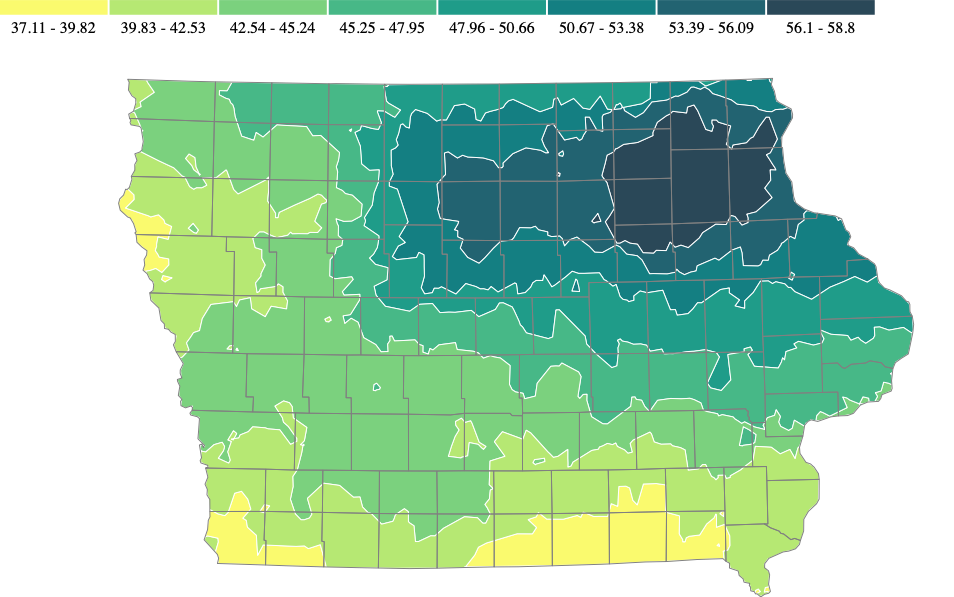
Isarithmic Map
Isarithmic Mapping of Yearly Total Precipitation, Source: [The Iowa Environmental Mesonet (IEM)]

Final Project
This project includes an animated graduated color map of children lead poisoning in Chicago community areas, 1999-2013.