Geovisualization Projects
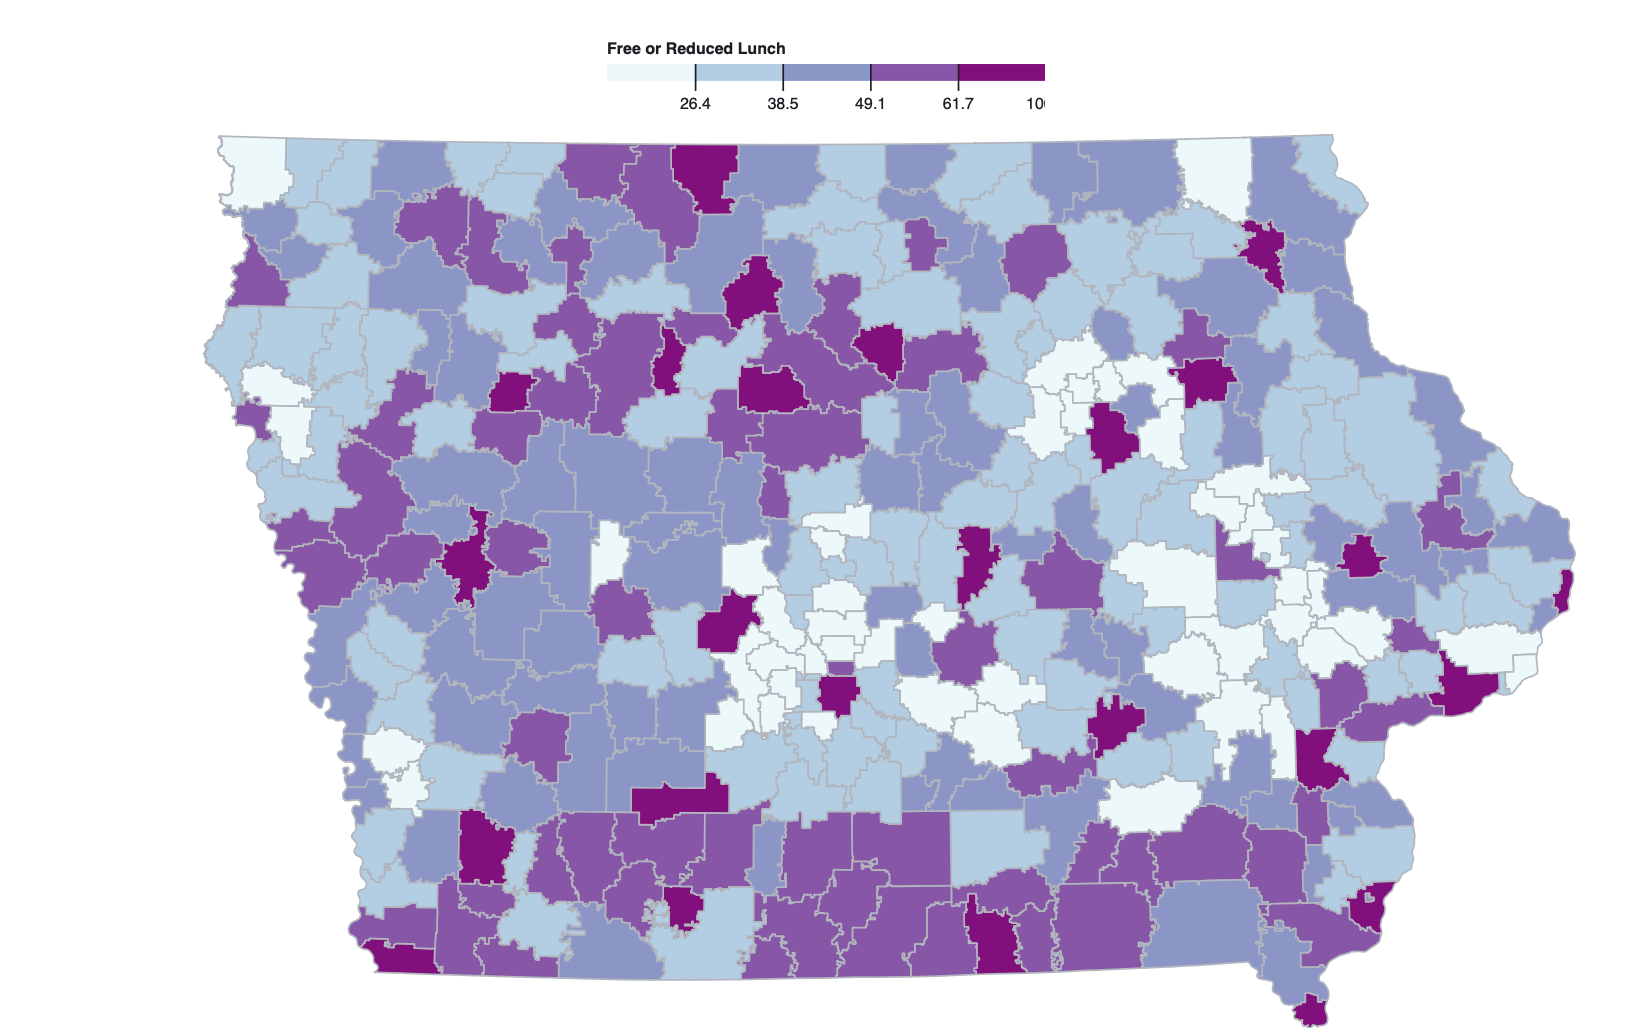
Food Insecurity by School District (Observable Notebooks)
This choropleth map displays the percentage of children enrolled in each Iowa school district that received free or reduced lunch during the 2019-2020 school year.
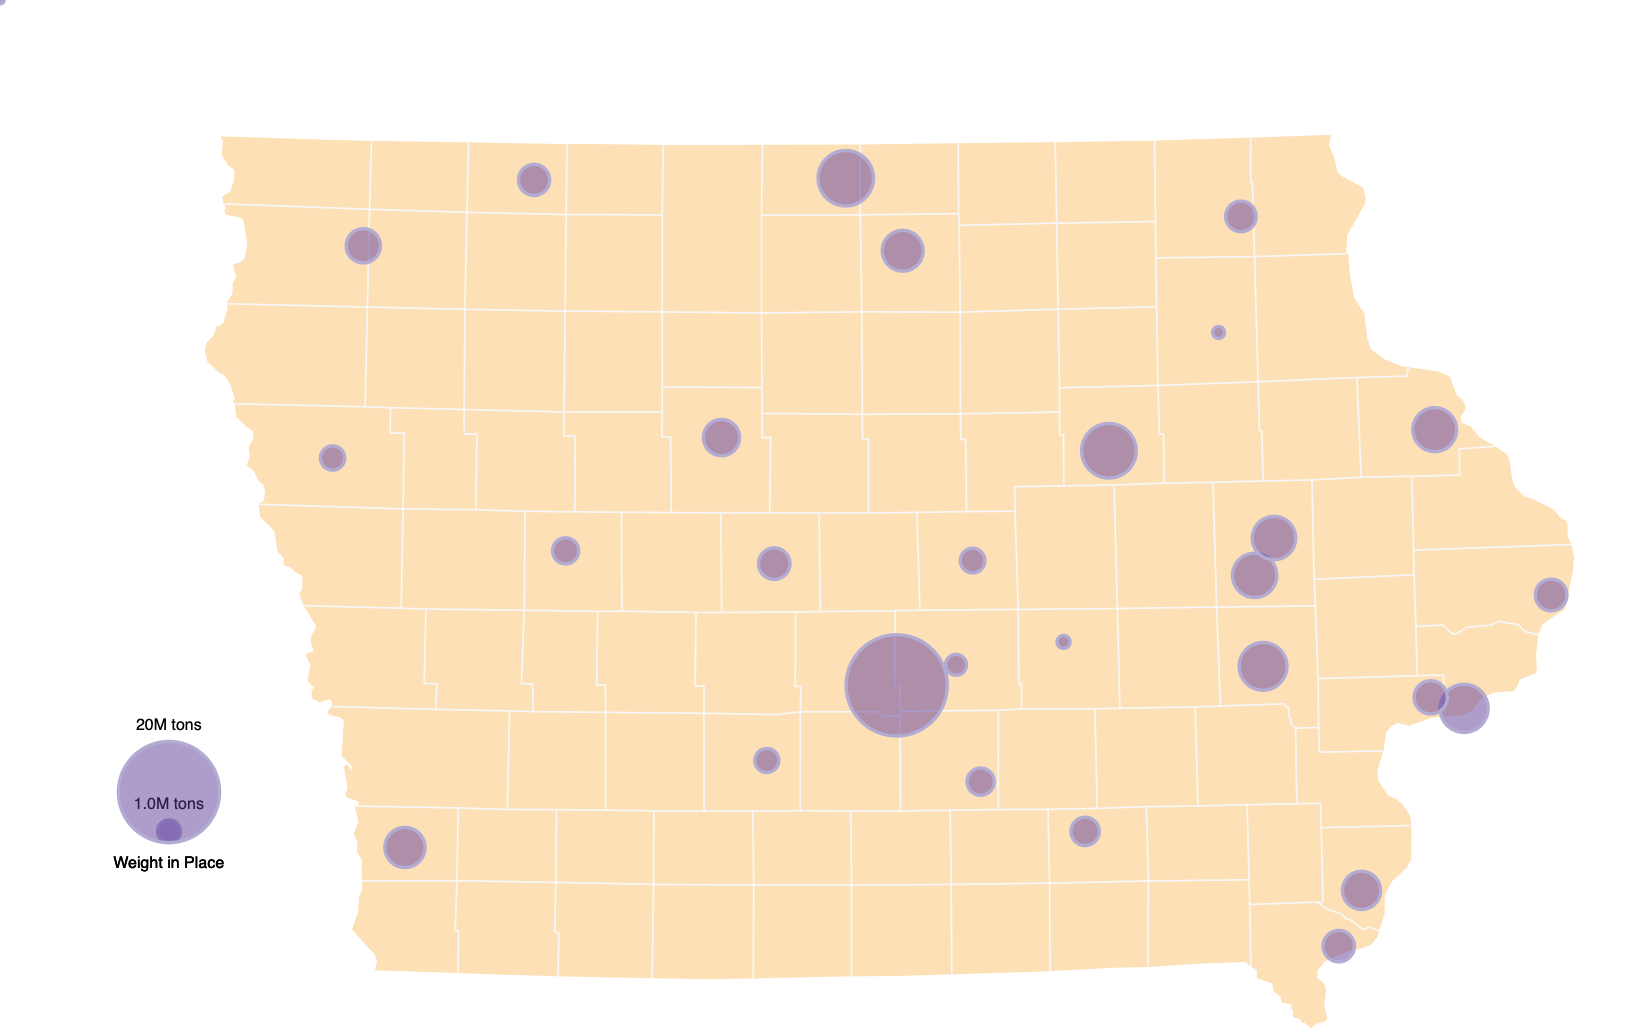
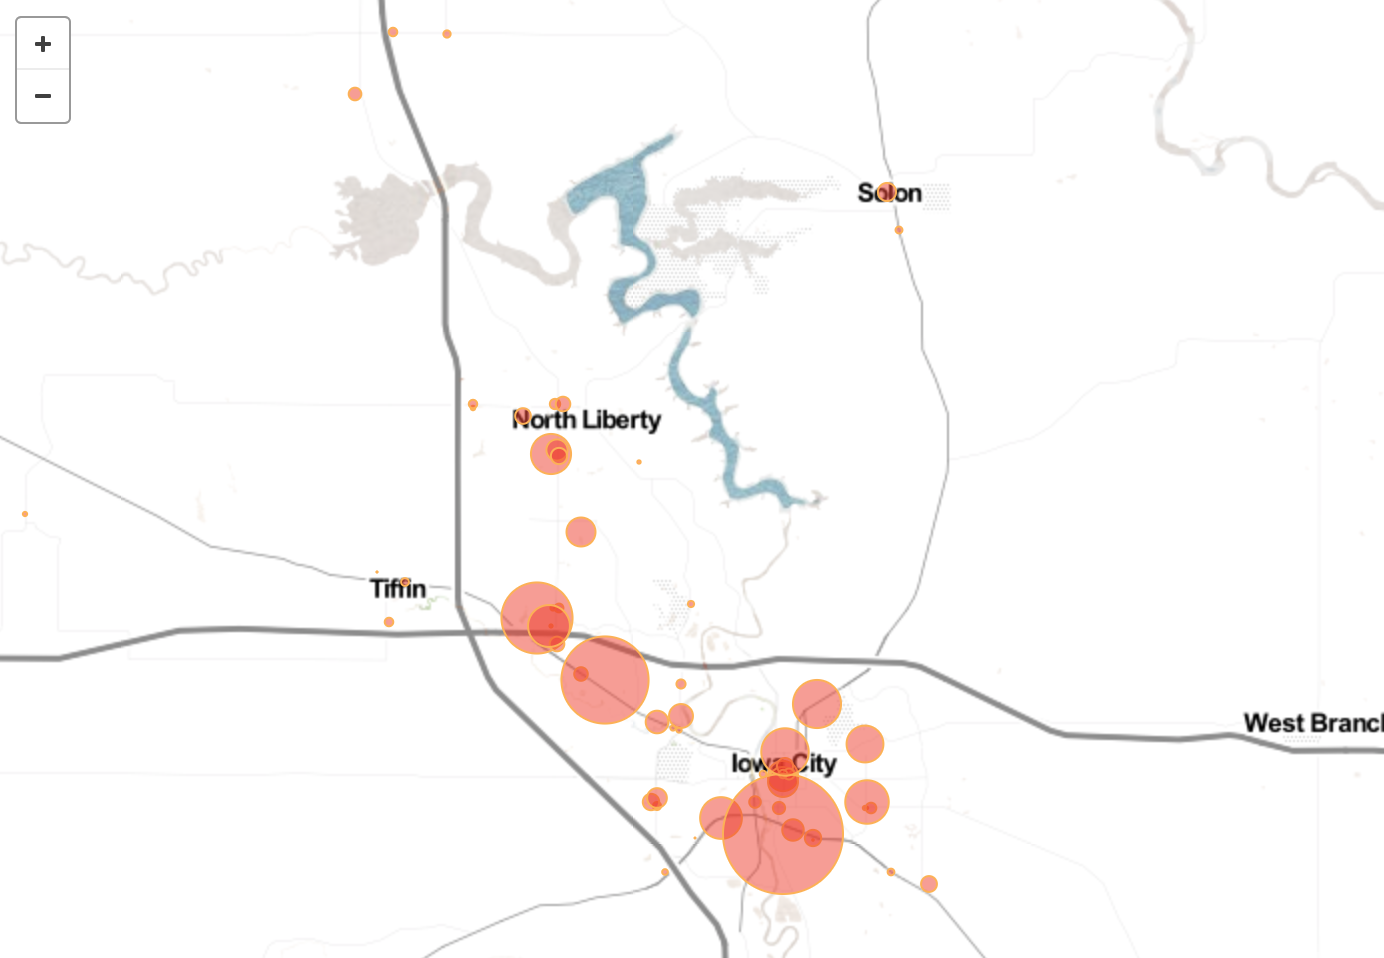
Waste in Place at Iowa Landfills (Observable Notebooks)
This proportional symbol map displays tons of waste in place at Iowa landfills as of 2018.
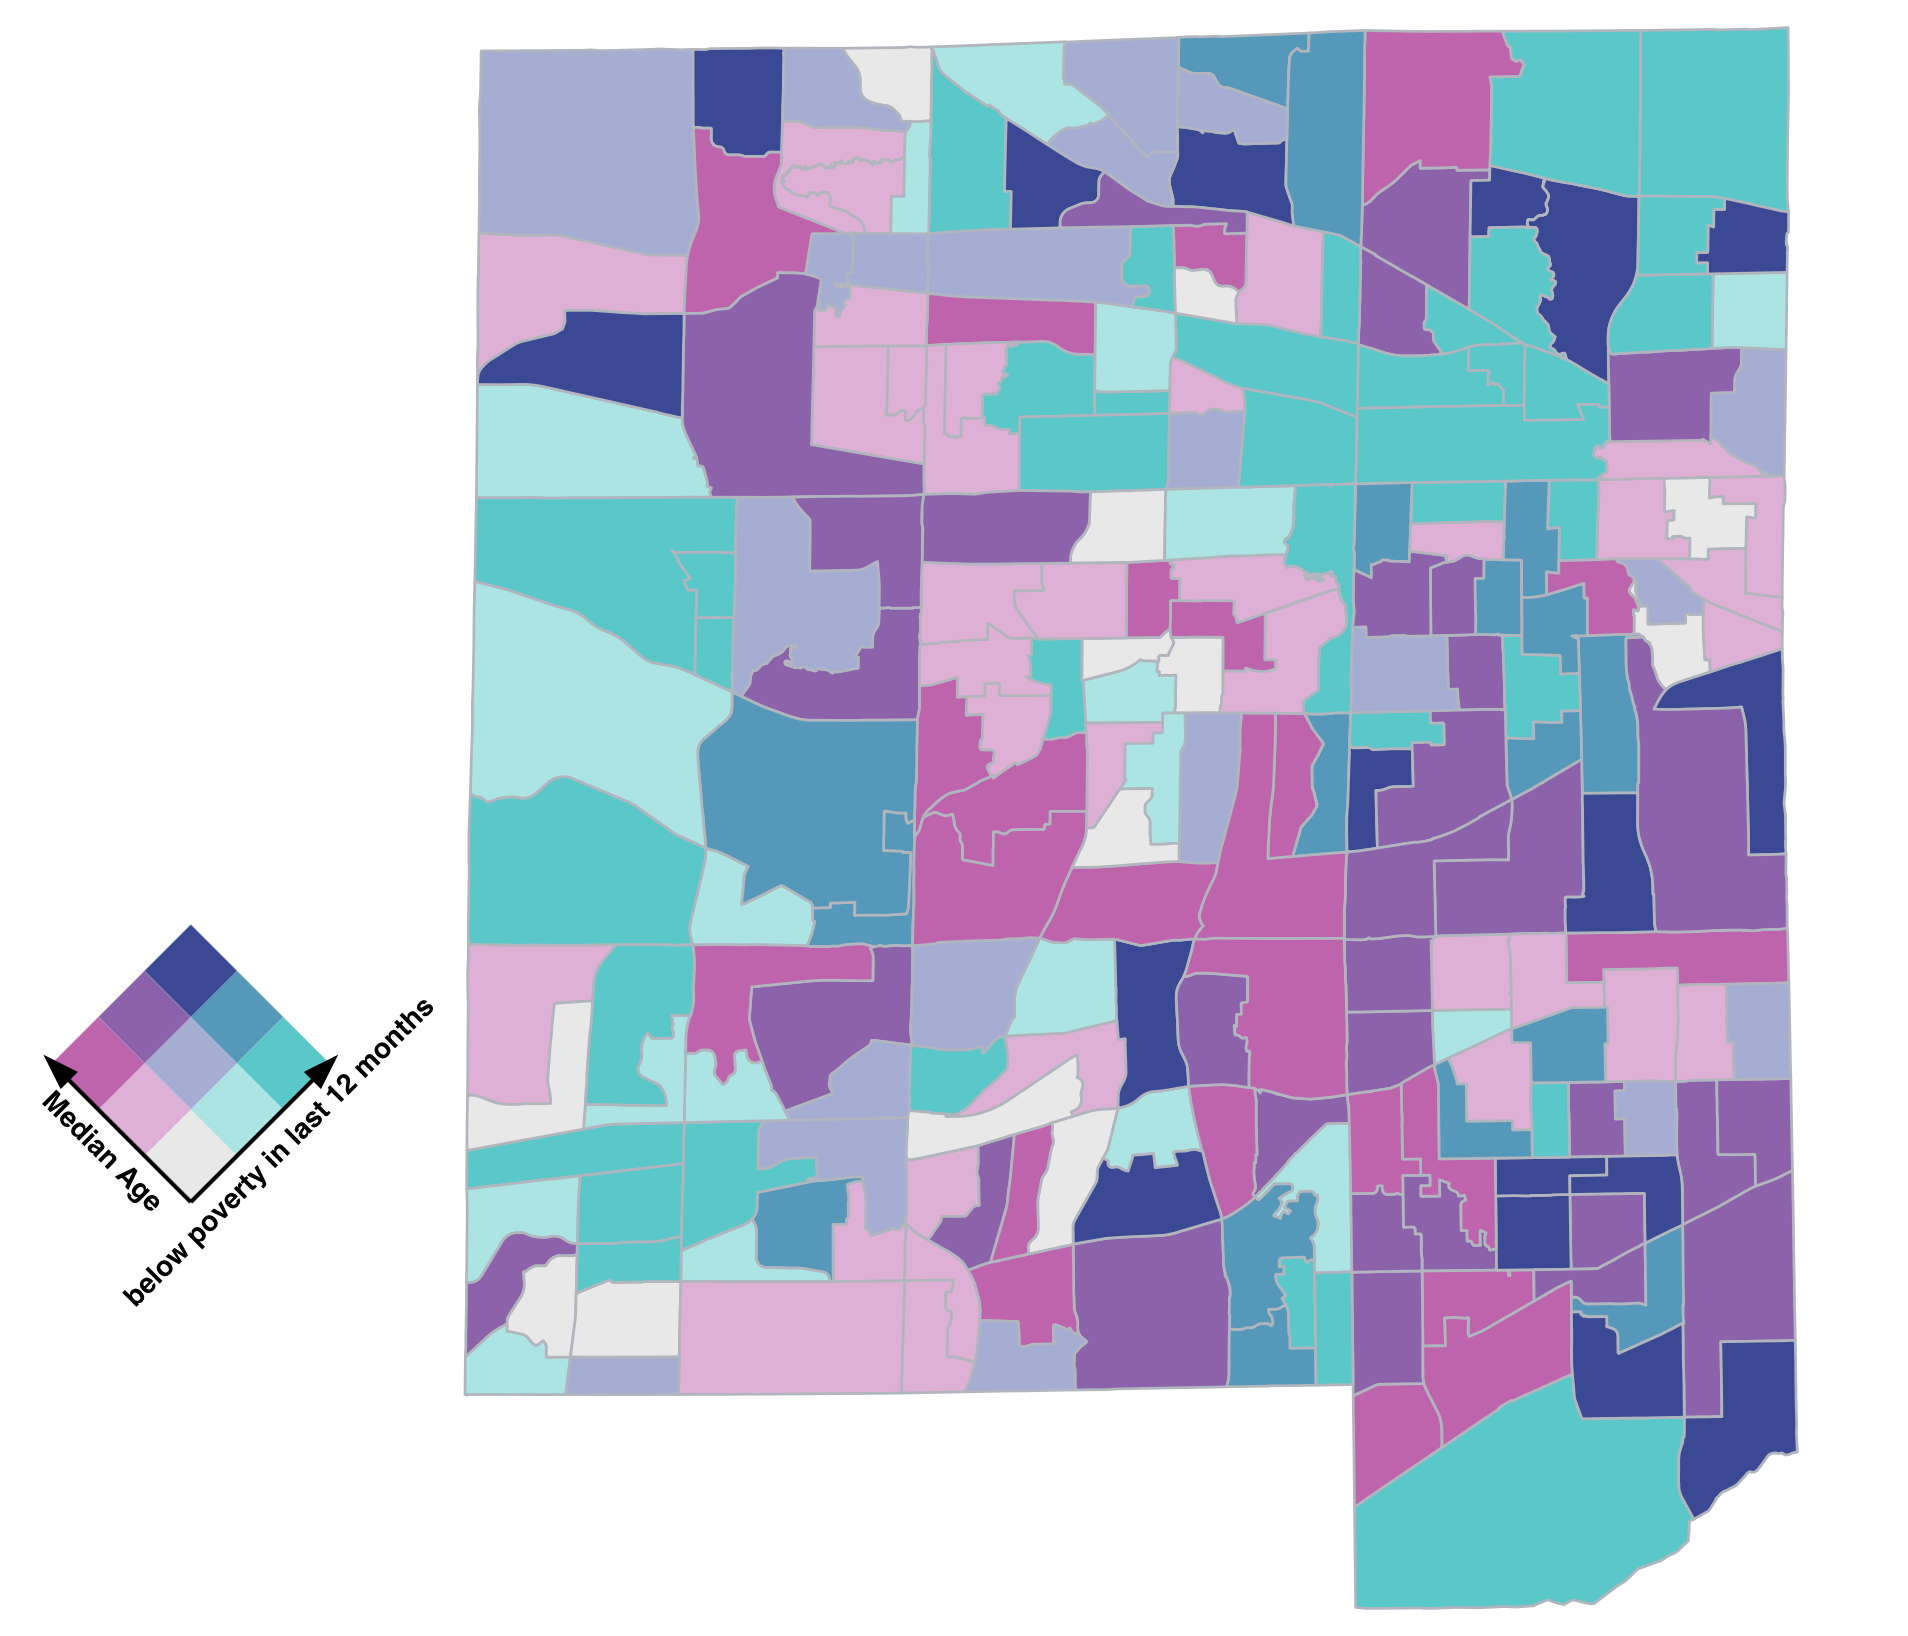
Median Age vs. Poverty Status in DuPage County, IL (Observable Notebooks)
This bivariate choropleth map displays both the median age and the proportion of residents who lived at or below the poverty line in the last 12 months for census tracts in DuPage County, IL. Data is based on five-year averages from the 2017 American Community Survey.
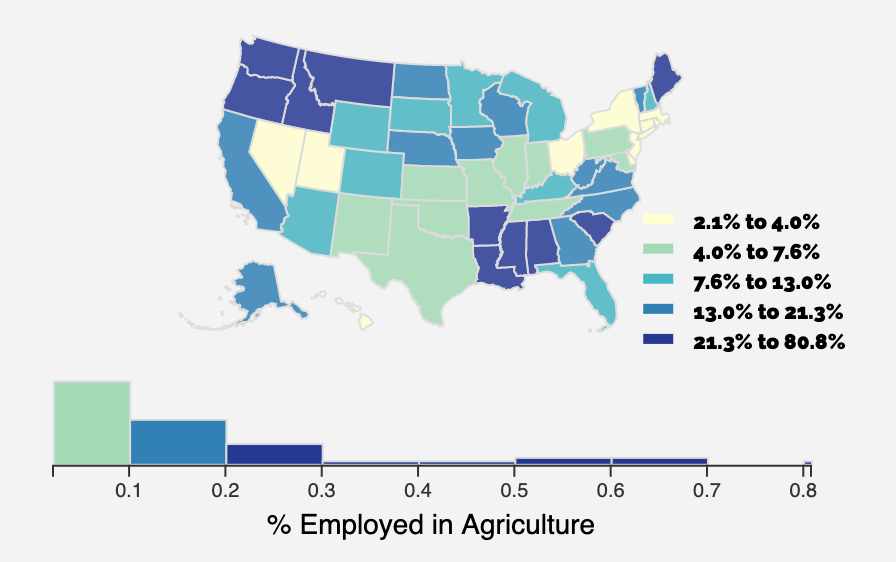
Industry Prevalence in State Workforces
This page displays four choropleth maps of the U.S. comparing the relative prevalence of four industries in different states.
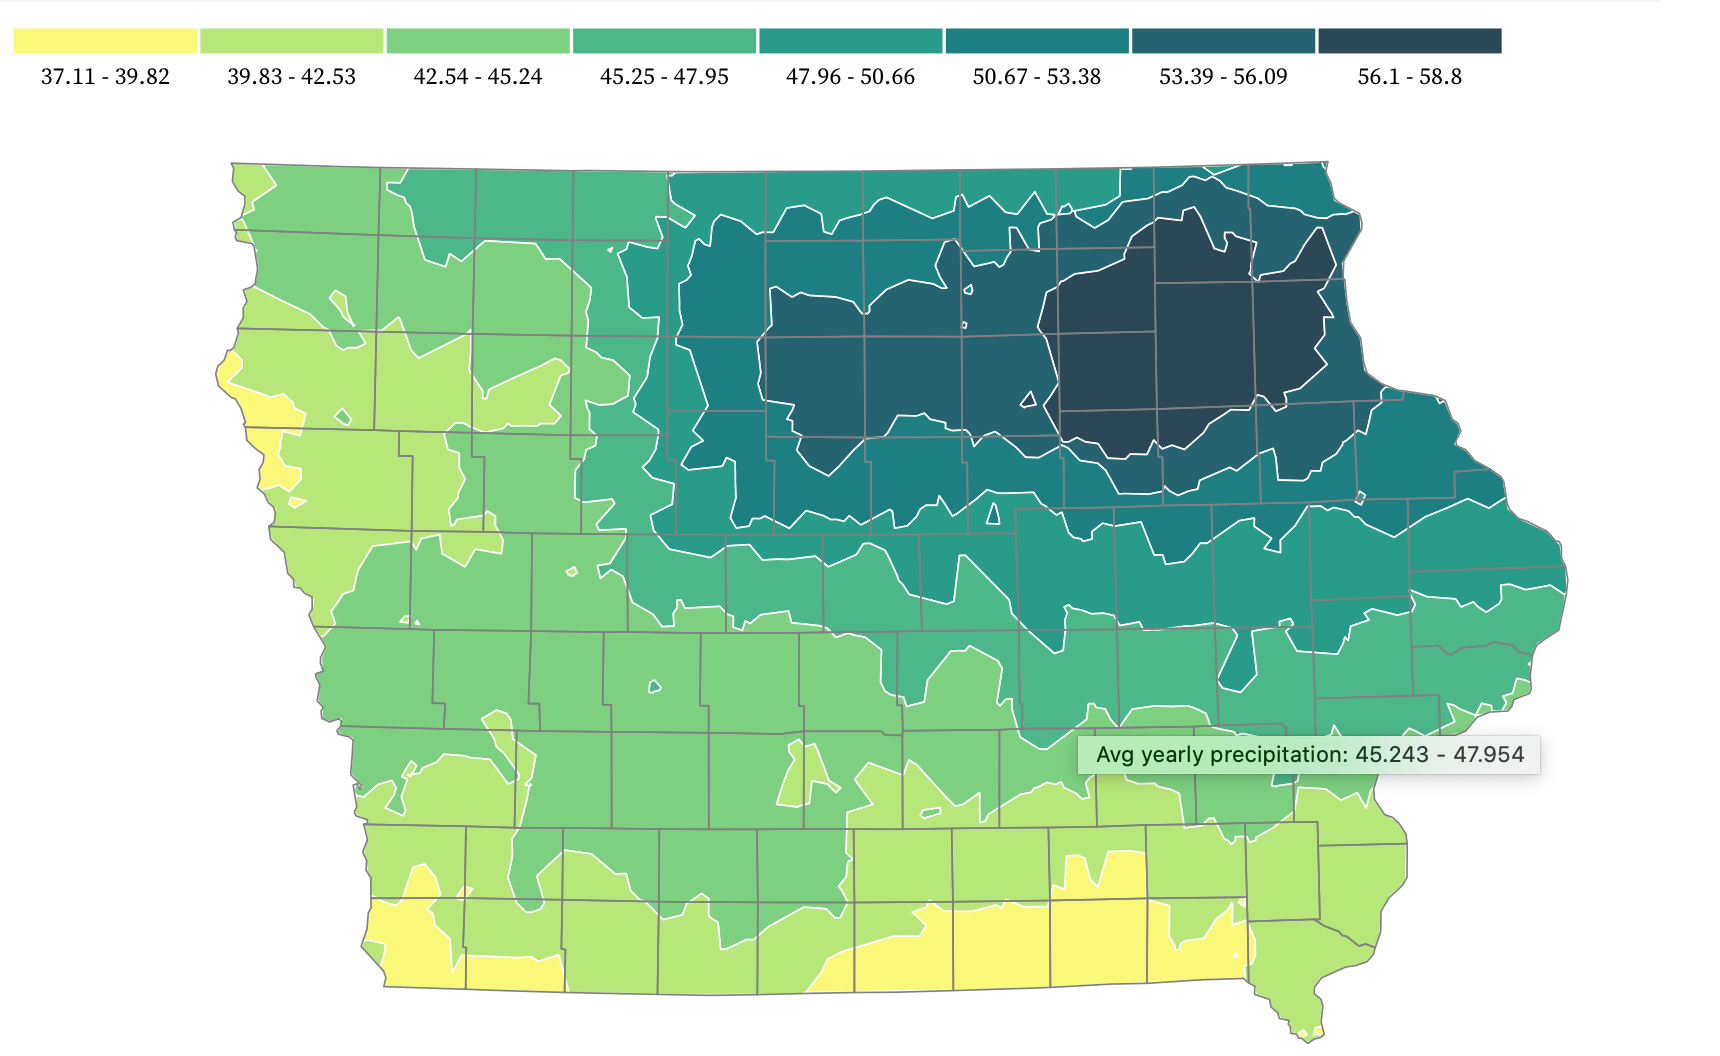
Yearly Total Precipitation
This page (made by Dr. Koylu, not me) displays annual cumulative precipitation across the state of Iowa in an isarithmic map.
Final Project: Liquor Sales and Drunk Driving in Iowa
This collection of maps made by myself, Emily Manders and Derek Tate, displays liquor sales in Johnson County by store, as well as statewide consequences of irresponsible drinking. I made the first map.