Midwest Medical Provider Landscape:
Medical Providers and County Demographics
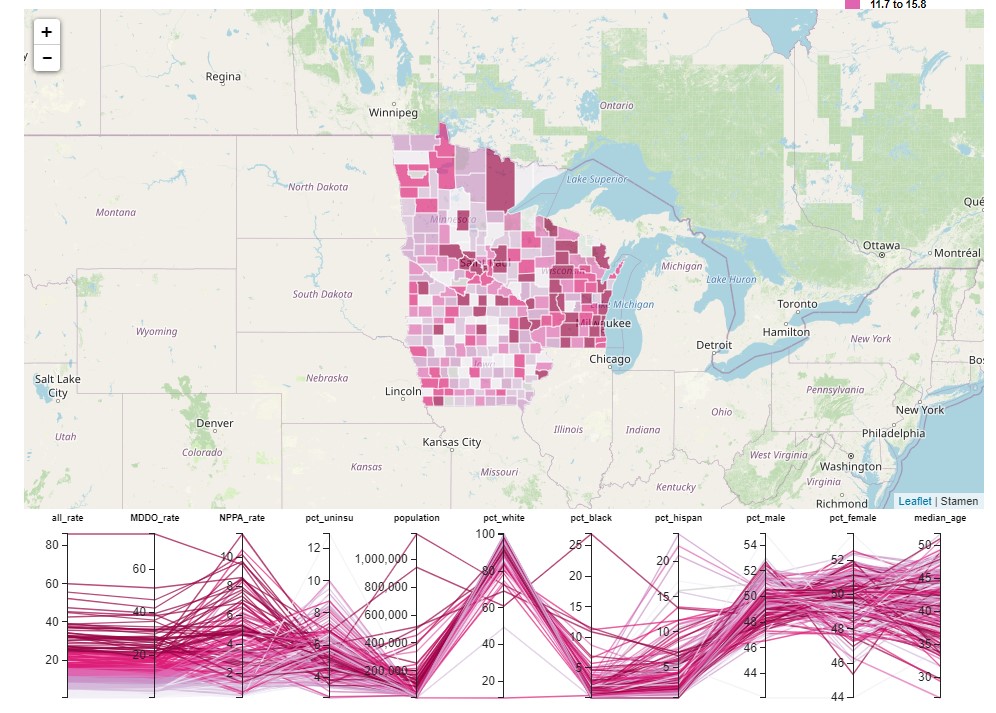
This interactive parallel coordinate plot and choropleth map helps show the relationship between rates of medical providers in the midwest in 2023 and several demographic characteristics of these coordinates.
Rates of Medical Providers & Uninsured Population
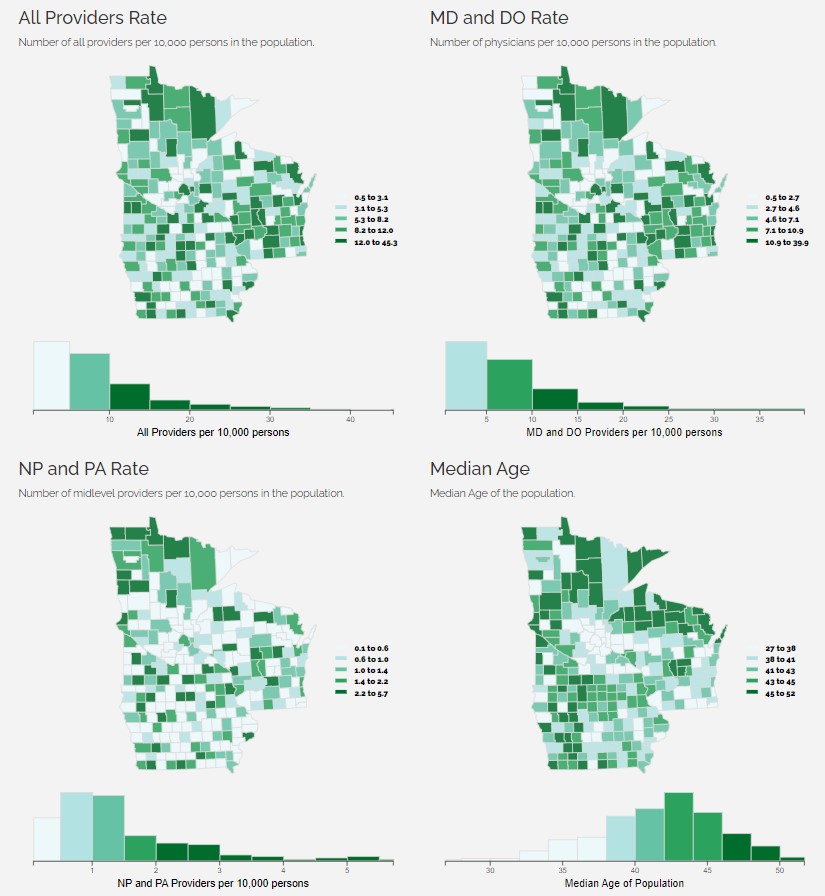
The small multiples map shows a similar grouping of low rates of midlevel providers and physicians around the Minneapolis/St. Paul metropolitan area.

Percent Change of Medical Providers
The small multiples maps show the percent change of medical providers for each county in the midwest every 2 years 2015 to 2023.

Percent Change of Physicians
The small multiples maps show the percent change of physicians (MDs and DOs) for each county in the midwest every 2 years 2015 to 2023.
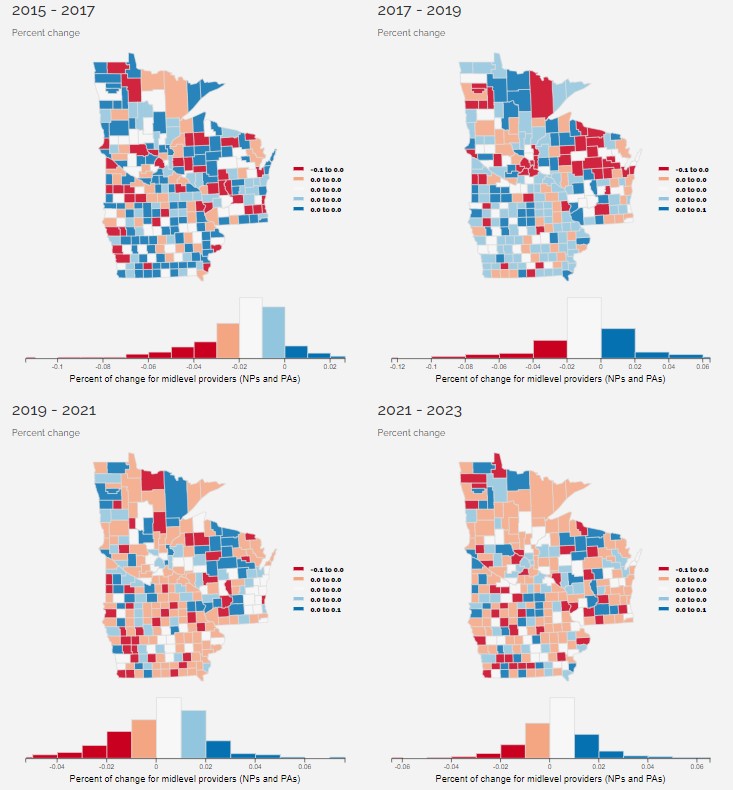
Percent Change of Midlevel Providers
The small multiples maps show the percent change of midlevel medical providers (NPs and PAs) for each county in the midwest every 2 years 2015 to 2023.
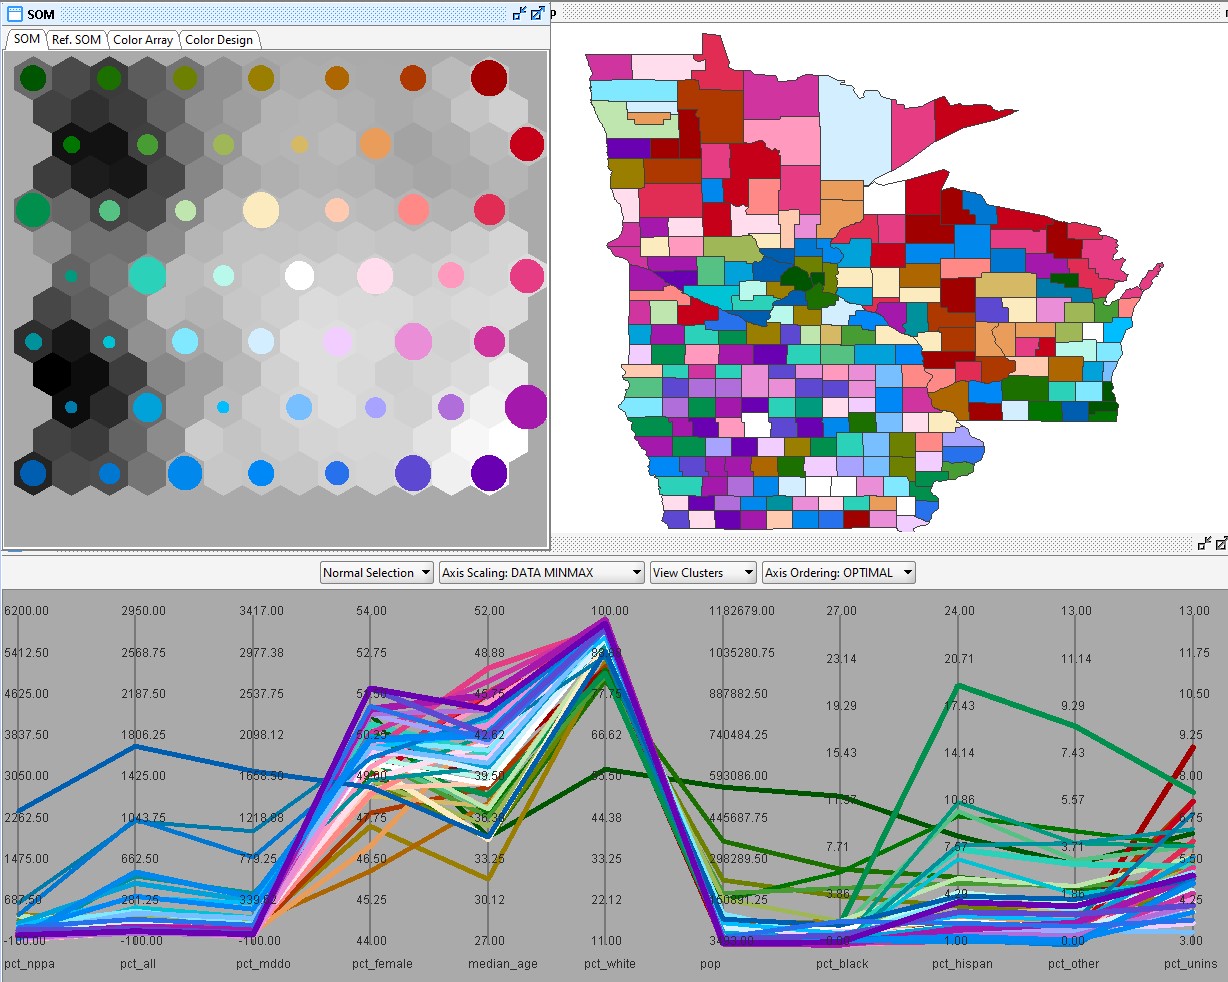
Medical Provider and Population Demographics Clustering
This map is a self organizing map that uses multiple population demographic characteristics as well as provider rates and population changes to examine for clustering within the midwest counties.