Swine density & seasonal variations of E. coli in Iowa waterways
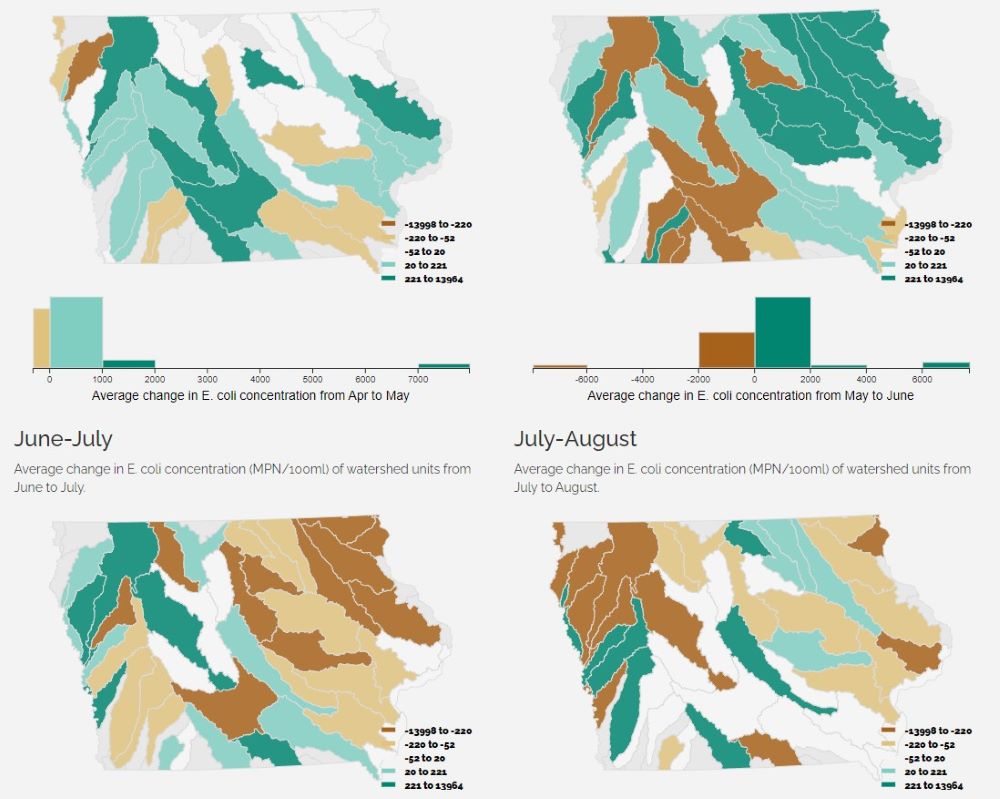
Monthly Changes in E.coli Concentrations
This webpage uses several small multiple choropleth maps to demonstrate the seasonal changes in E.coli concentration in Iowa waterways from April to October.
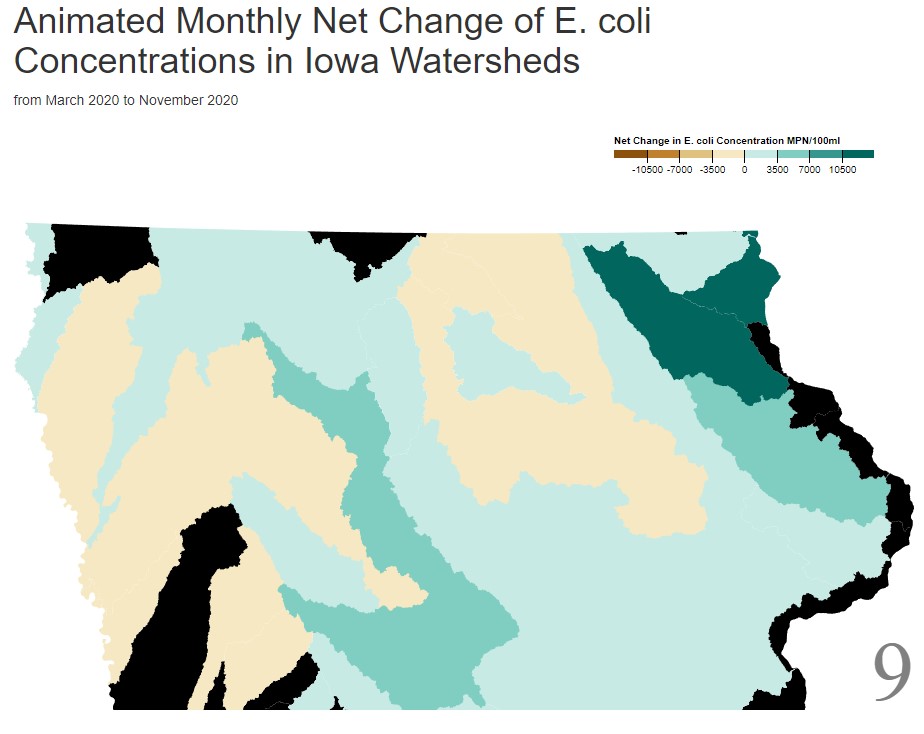
Animated map of Monthly E.coli Concentration changes
An animated version of the choropleth maps shown in the previous projects allows for a smooth visualization of the changes over the montly time periods.
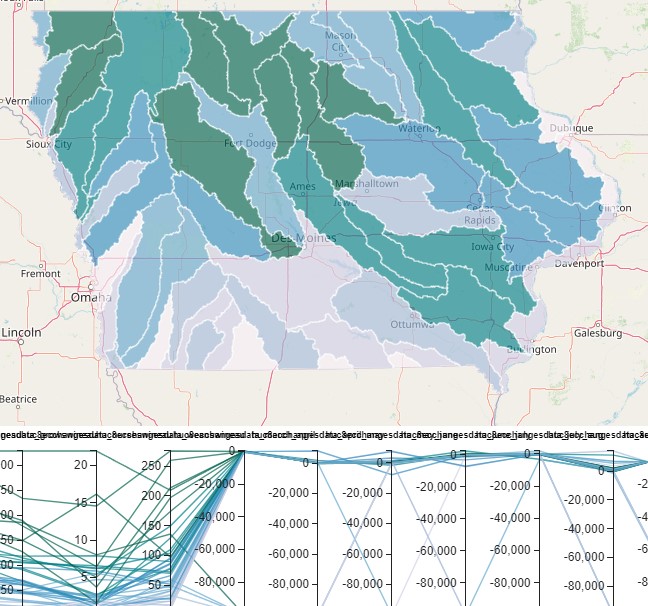
Monthly E. coli changes and Swine densities
This choropleth map and parallel coordinates plot allows for the visualization of realtionships between CAFO swine desnsities and monthly changes in E. coli concentrations in Iowa.
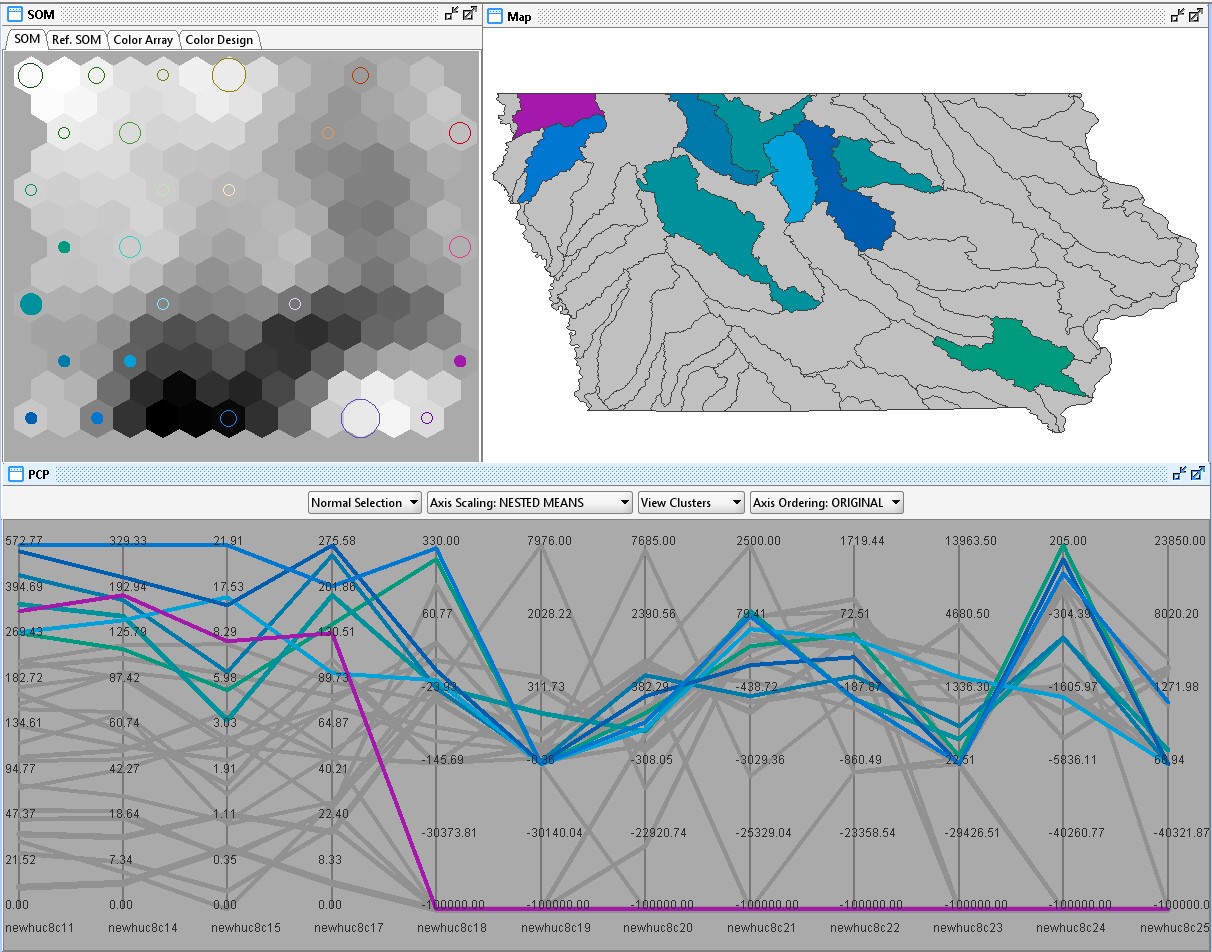
Monthly E. coli changes and Swine densities using SomViz
This visualization tools allows for relationships within mutlivariate datasets to be examined and clusters with similar attribute patterns to be identified.
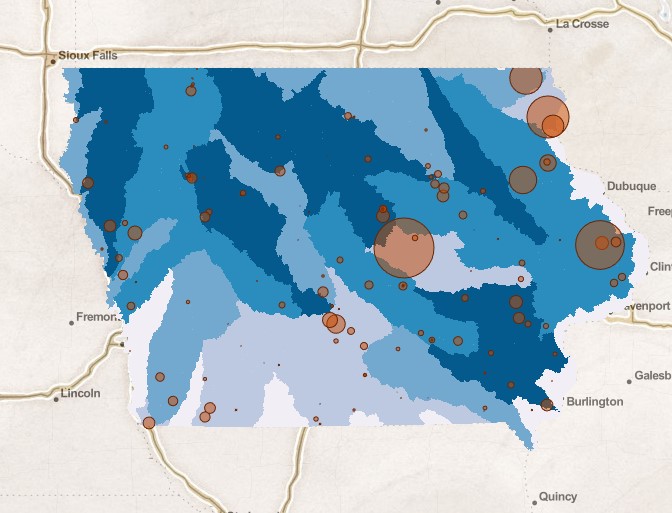
Average E.coli Concentrations at Sampling locations in June
The average E.coli concentrations in June at individual sampling locations in respect to total swine animal unit density per square mile in each watershed.
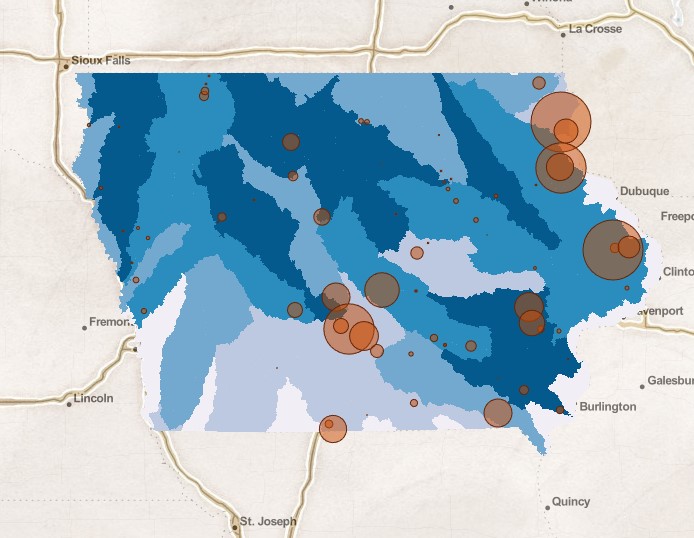
Average E.coli Concentrations at Sampling locations in September
The average E.coli concentrations in September at individual sampling locations in respect to total swine animal unit density per square mile in each watershed.