SomViz: Changes in E. Coli Concentrations and CAFO Swine Densities in Iowa
SomViz is a visualization method that allows the user to observe connections within multivariate datasets. In this utilization, the average monthly changes in E.coli concentrations from March to November are examined in relation to the swine densities (animal unit per square mile) of several different swine phases (wean, nurse, grow, and total). The definitions and labels used in the vizualization are found below.
- totalswineau: Total swine animal units/square mile
- growswineau: Grow swine animal units/square mile (The last stage before the pigs reach market weight is the grow category)
- nurseswineau: Nurse swine animal units/square mile (Piglets are moved to a sperate confinement barn for nursing)
- weanswineau: Wean swine animal units/square mile (Piglets are typically weaned 2-3 weeks after birth from isolated pens)
- Monthly ranges: Net change in E.coli concentrations from the first month to the second month listed
Since SomViz results may sometimes be overwhelming, high value clusters for attributes of interest were filtered in using dynamic brushing. This allows for a more detailed and specific examinations of the multivariate relationships associated with high values of each specific attribute.
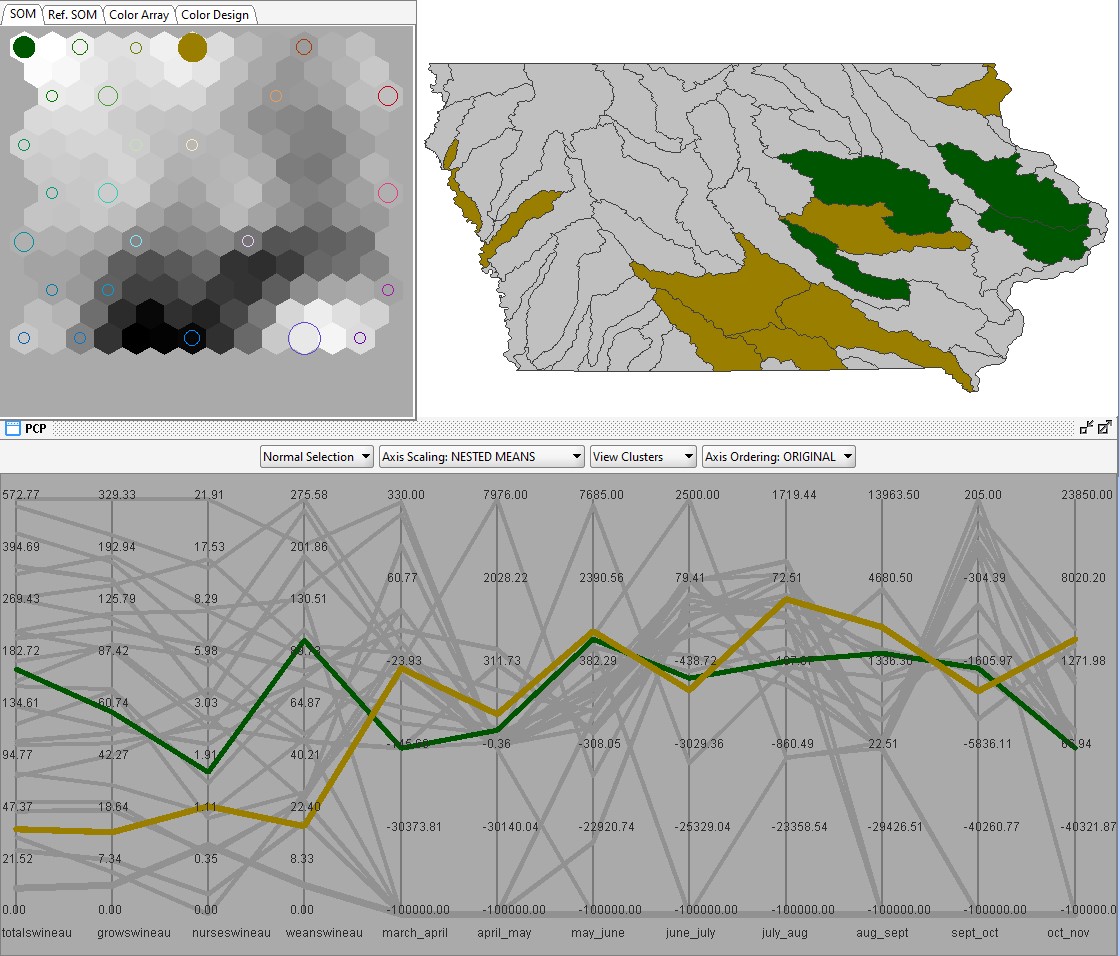
Total swine animal units/square mile:
Clusters with the top seven highest total swine animal units per square mile, were selected and their relationships and locations in Iowa can be seen on the map below. There was not much variation between the differnt swine types, as seen by the colored lines in the PCP (parallel coordinates plot) being relatively straight from the attributes "totalswineau" to "weanswineau". Because of this, only the filtered clusters for the total swine animal units will be shown. All clusters follow a relatively similar pattern except for the pink cluster. Although the pink cluster had similar swine densities as the other clusters, their net change in E.coli concentrations all jump down to the value of -100000. This is not the true net change value. Instead this represents null, or missing, measurements, indicating that there was a lack of sampling in this particular watershed in 2020.
When focusing on the blue and green clusters identified, the majority fall in the north central region of Iowa and also follow a relatively similar pattern for the net change in E.coli concentrations. The main takeaways of these temporal patterns for clusters with high swine density include:
- Although there appears to be a fluctuating pattern, be cognizant of the values for each attributes number line. They are not all on the same scale.
- The most significant postive net changes in E.coli concentrations were seen between the months of May-June, August-September, and October-November.
- May-June and August-September correlate to the pre-planting and post-harvest seasons, coinciding with the periods of the year when manure is typically spread.
- The greatest amount of negative net change in E. coli concentration was seen in the month of September-October.
- There is not a strong overall correlation between the clusters that have high swine denisities and the clusters with the highest positive net change in E.coli concentrations from month to month.
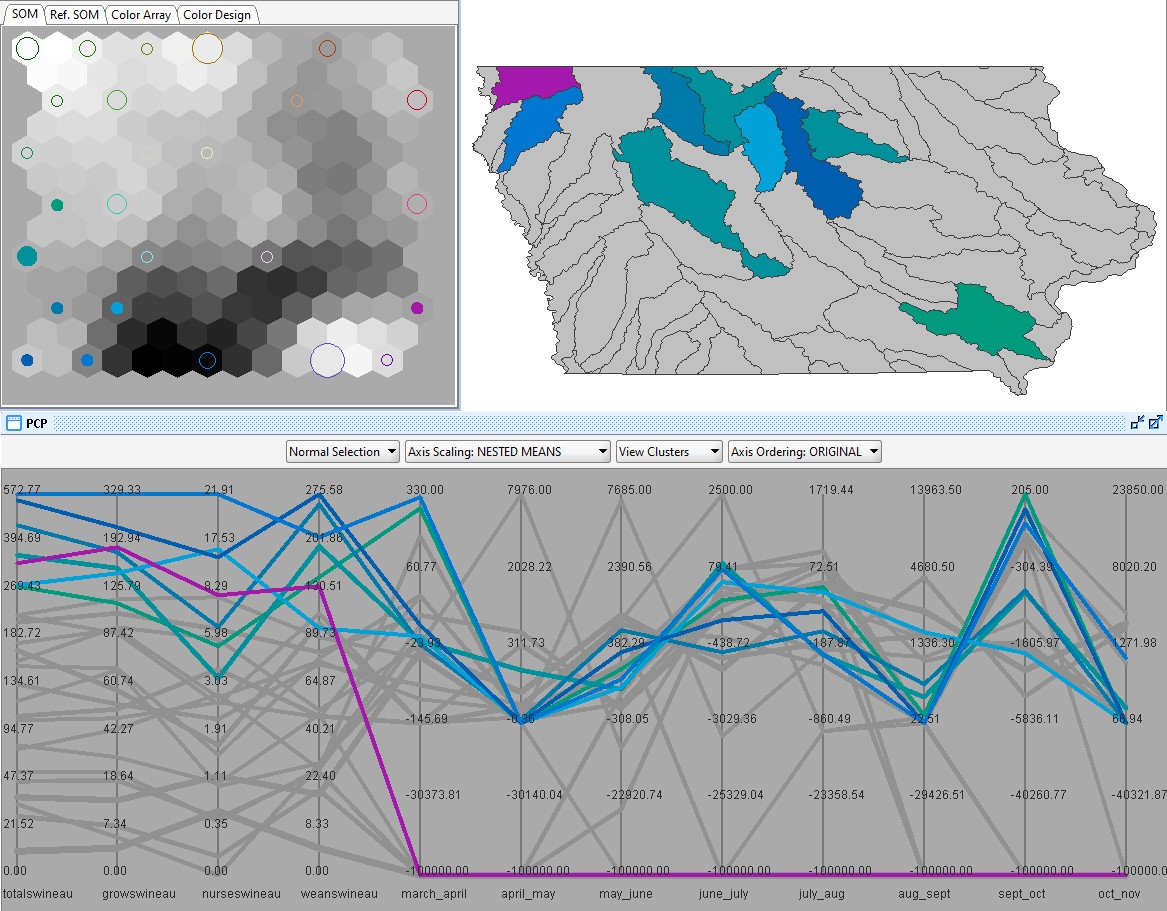
Changes in E. coli concentrations: May-June & August-September
Since the months of May-June and August-September had the highest amount of positive net change as seen in the plot above, these months were further examined. Below are the Somviz results when selecting the clusters with the highest net change in E. coli concentrations during each selected month using dynamic brushing. Unlike the plot above, there is not a clear temporal pattern seen on the PCP for the monthly changes in E. coli concentrations. However, there are similarities in the spatial patterns of the clusters when observing the map of Iowa. The locations of the largest clusters, the dark green and brown, are directly south of the watershed units highlighted in the previous map as having the highest total swine densities.
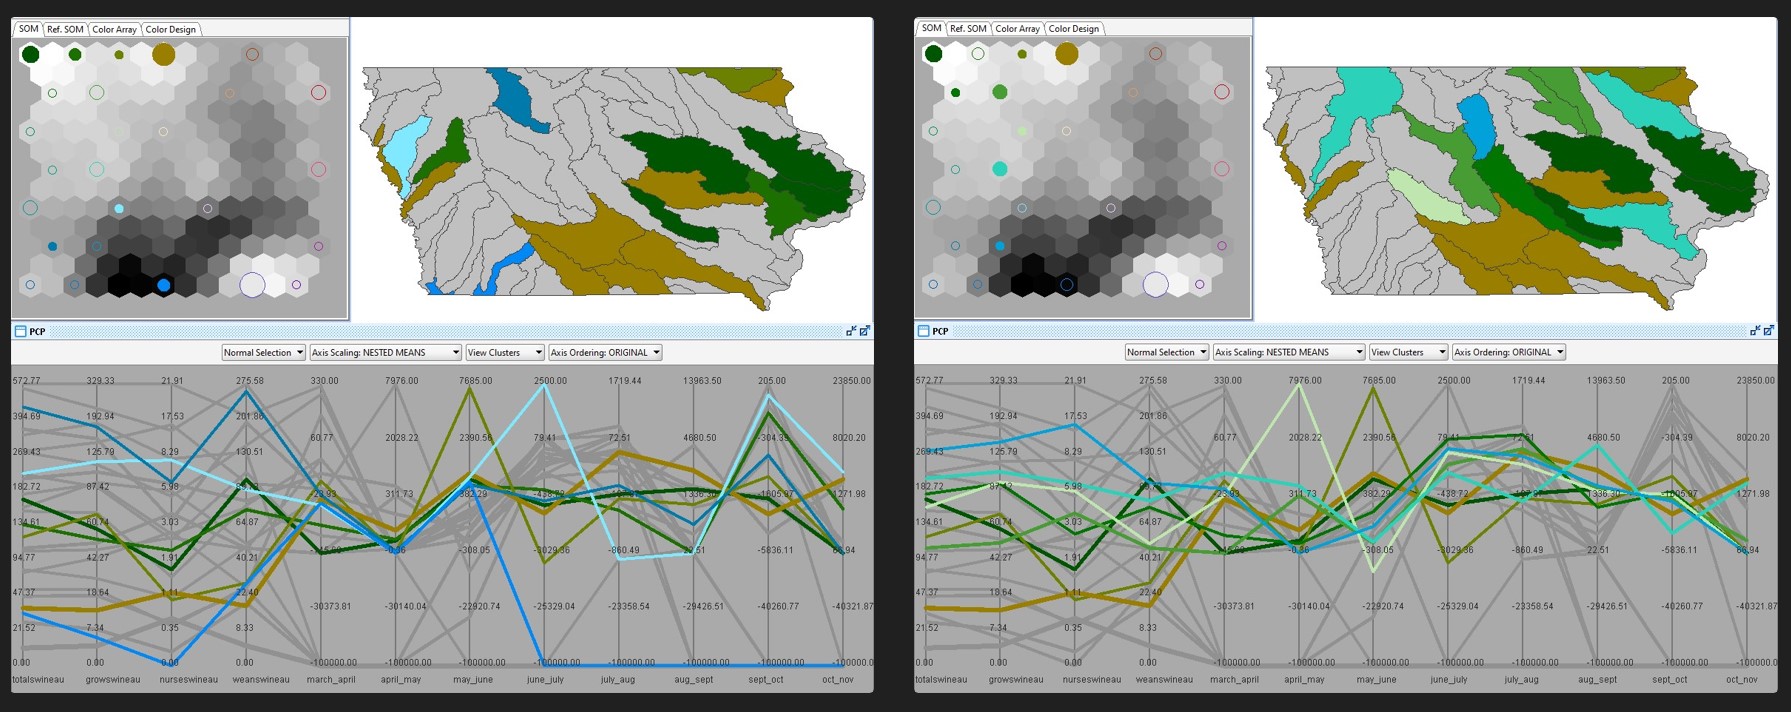
Cluster analysis:
The Somviz results for the dark green and brown clusters were selected and can be visualized below. Examining the monthly changes in E. coli concentrations shows that for both clusters, the months with the highest positive net change include May-June and August-September. These time periods along with the cluster's geographical positioning, indicates thats there may be downstream effects following seasonal activities, such as the spreading of manure, in watersheds south of those with increased swine densities.