Flow Map Migration flow 1887 to 1924.
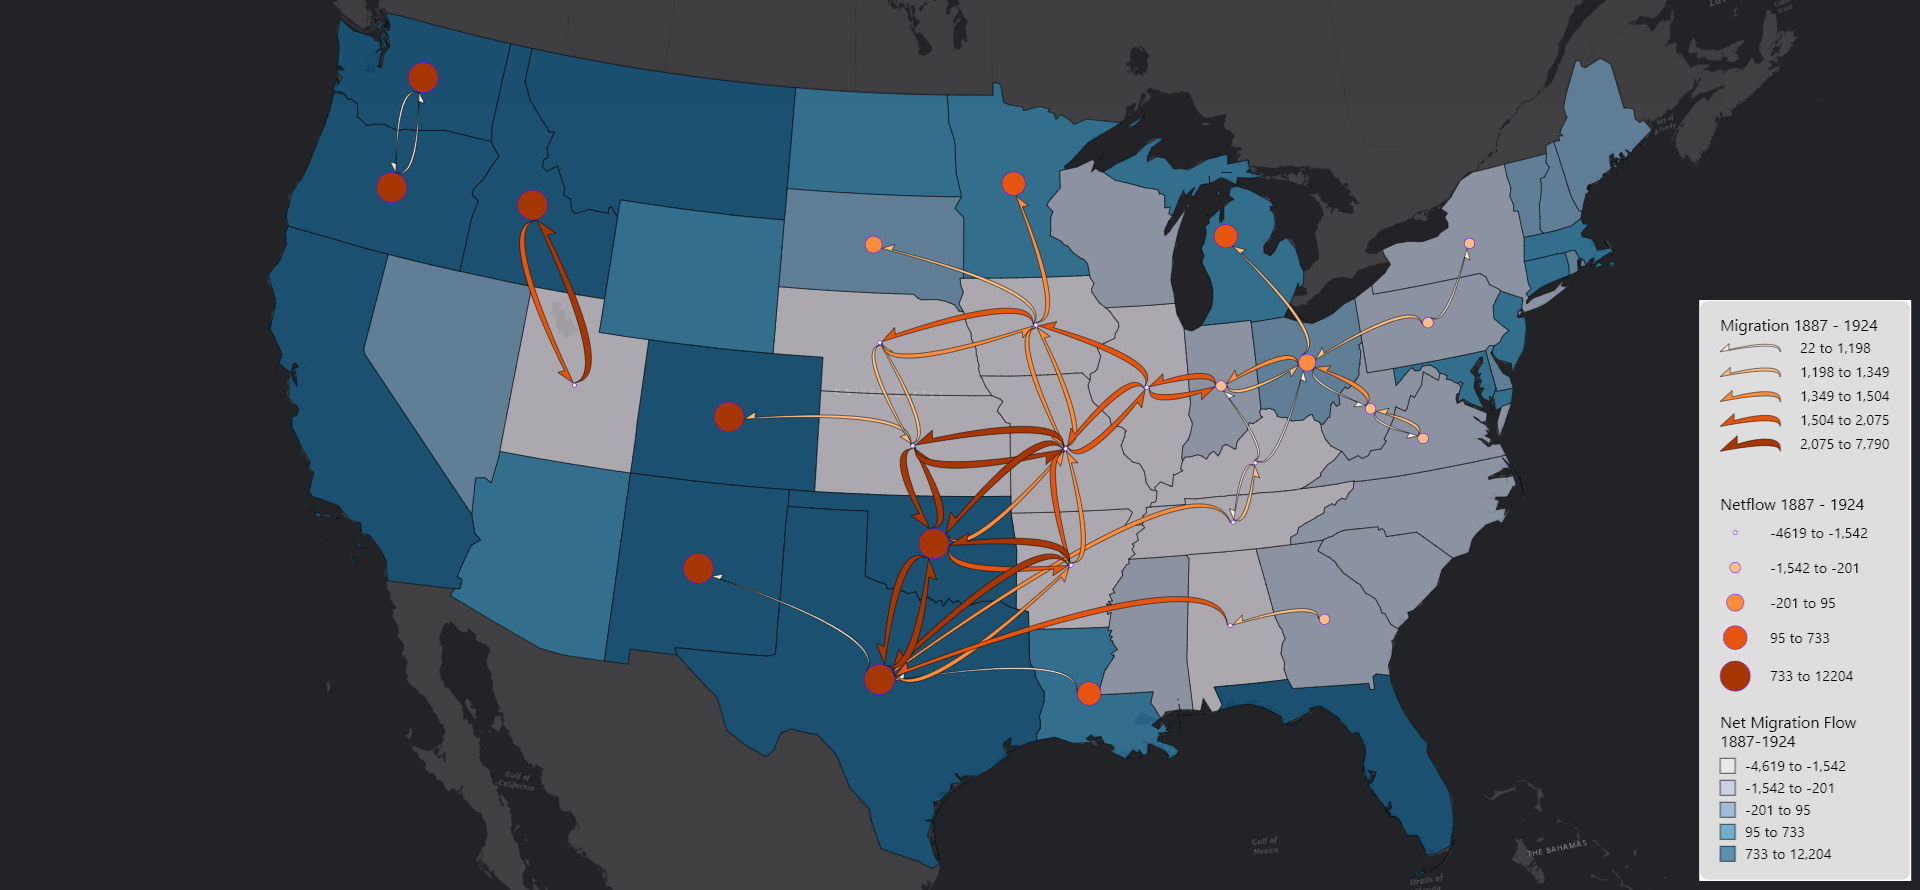
This is a map visualizing the flow of migration from the year 1887 to 1924. This only highlights the top 50 flows, including more than that has some severe overlap and becomes confusing to look at. Regardless, there is plenty to analyze here. We can see a large exodus from the midwestern states to the border states like Minnesota, Texas, New Mexico and even Louisiana.