What do people say when a hurricane occurs?
When natural disasters such as floods, wildfires,
and hurricanes break out, social media activity increases dramatically especially in the affected areas.
Social media users can play an important role as social sensors during disasters when it is hard to obtain situational
information by using traditional data collection techniques such as remote sensing and field surveying. Therefore, I am very
interested in utilizing situational information from social media to identify the affected areas by looking into spatiotemporal patterns of social media data.
In this project, I wanted to see if there are specific patterns in social media activity using Twitter data related to hurricane Irma.
Hurricane Irma 2017
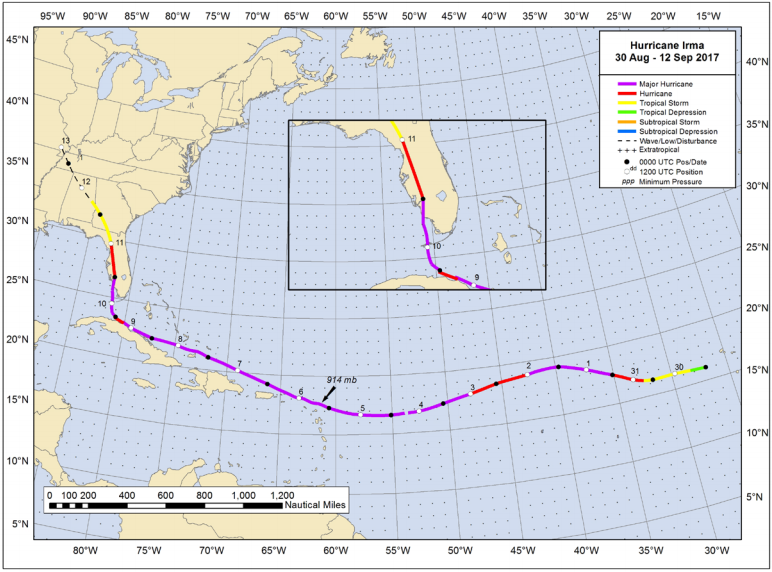
I conducted a case study with Hurricane Irma of 2017 which is the fifth-costliest hurricane in the United States history.
It was a Category 5 with wind speeds of 177 mph at its peak and was a Category 4 when it hit Florida on Sep 10, 2017.
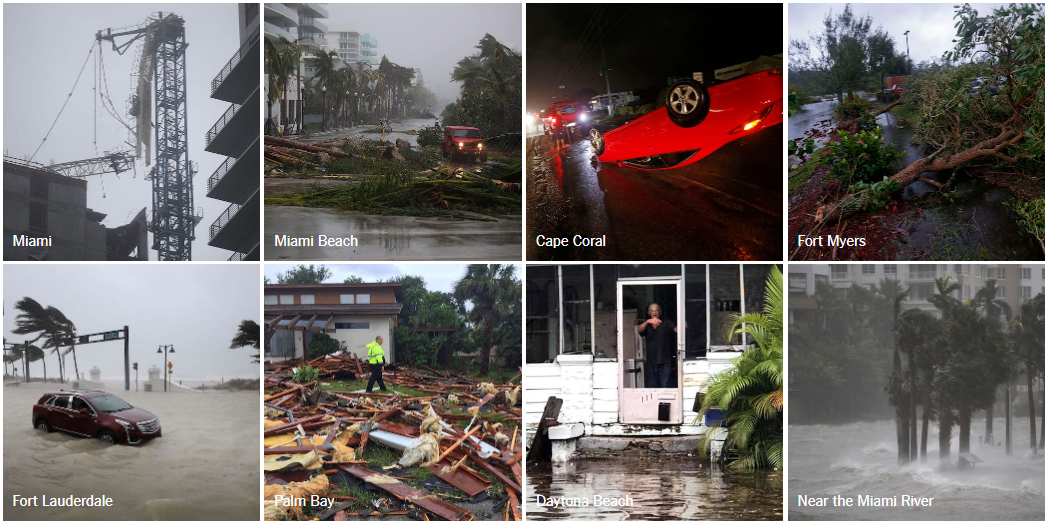
Irma affected several states in the South, especially Florida, and caused more than 120 fatalities and 50 billion dollars.
Twitter usage related to Irma
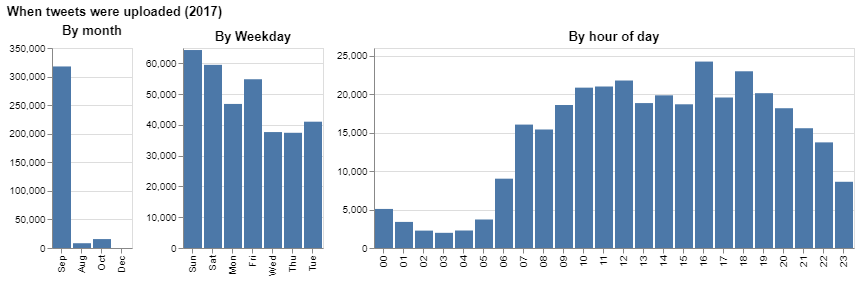
I used Twitter data related to hurricane Irma and this data was provided by Caglar Koylu. Tweets were collected using hurricane-related keywords such as 'irma', 'hurricane', 'flood', and 'storm'. The total number of collected tweets is 341,698. The bar graphs below represent the number of tweets aggregated by month, by day, and by hour of day. We can see that hurricane-related tweets are more likely to be uploaded on the weekend and in the late afternoon.
Tweet categories by contents
Tweets about hurricane Irma were classified into nine categories based on their contents since tweets can have different spatial patterns depending on their contents. I used the same categories as Sit, Koylu, and Demir (2019) classified, but excluded one category (news - aftermath). The nine categories used in this project are as below:
- Advice, warnings, and alerts
- Affected individuals: infrastructure
- Affected individuals: pets
- Affected individuals: preparedness
- Disrupted service
- Donations and support
- Government critiques
- News
- Sympathy
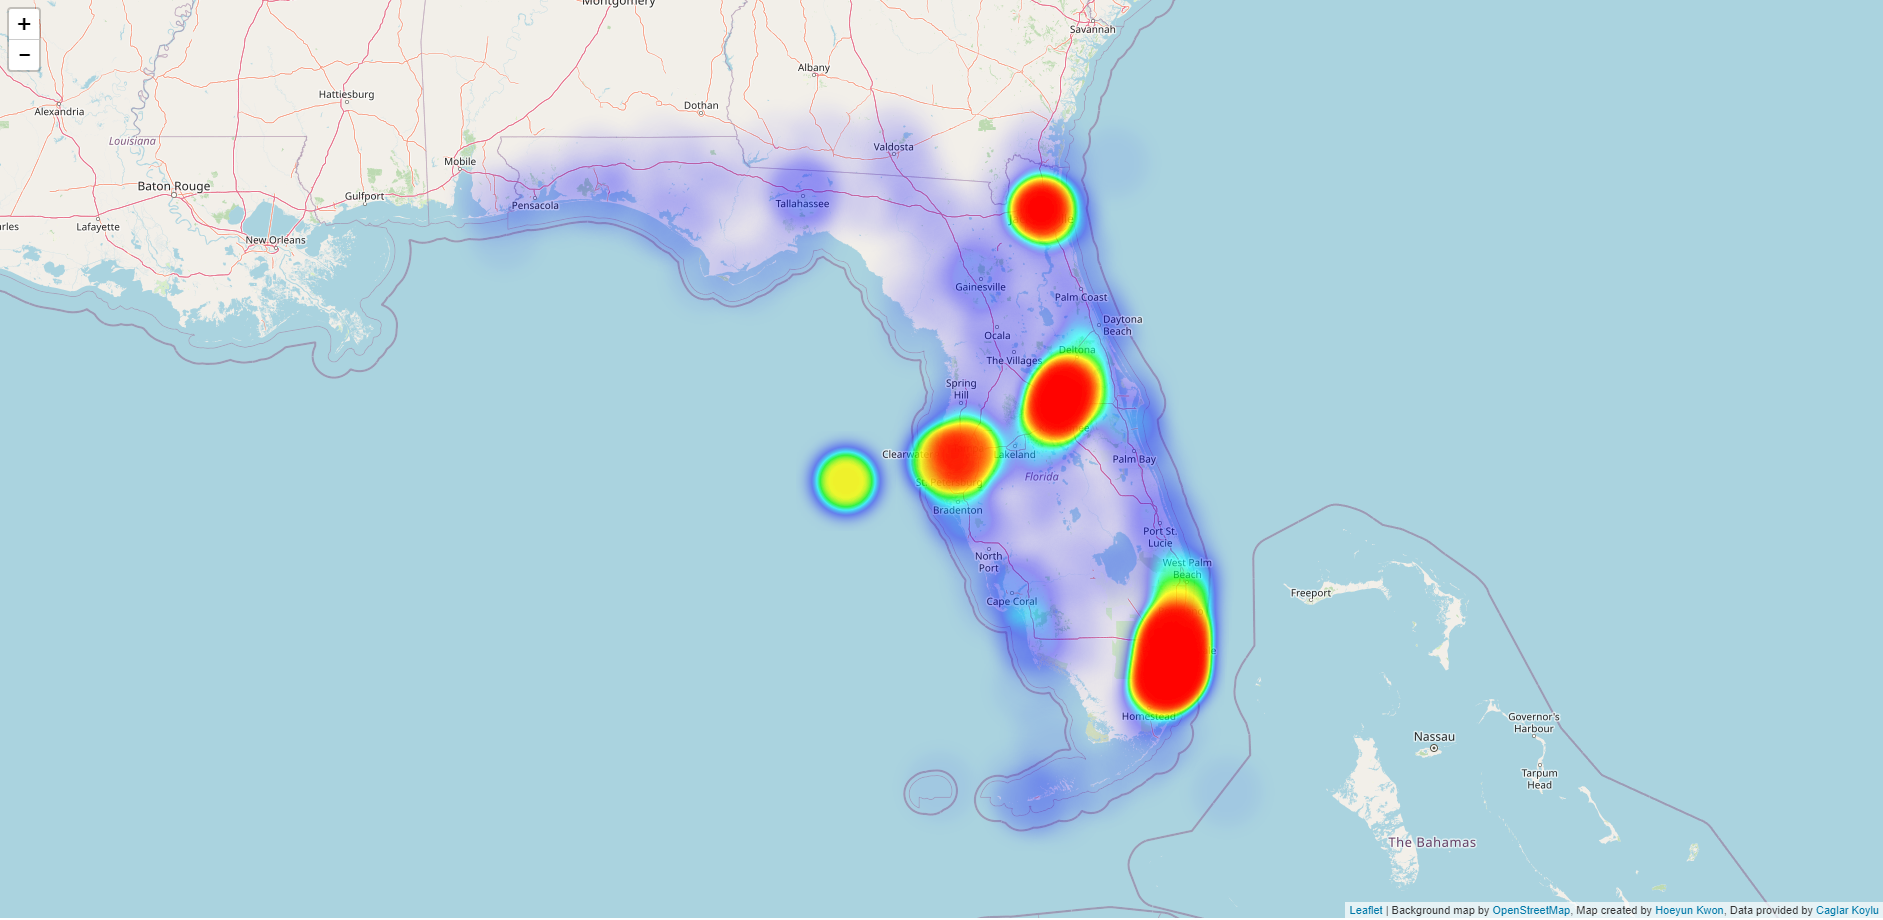
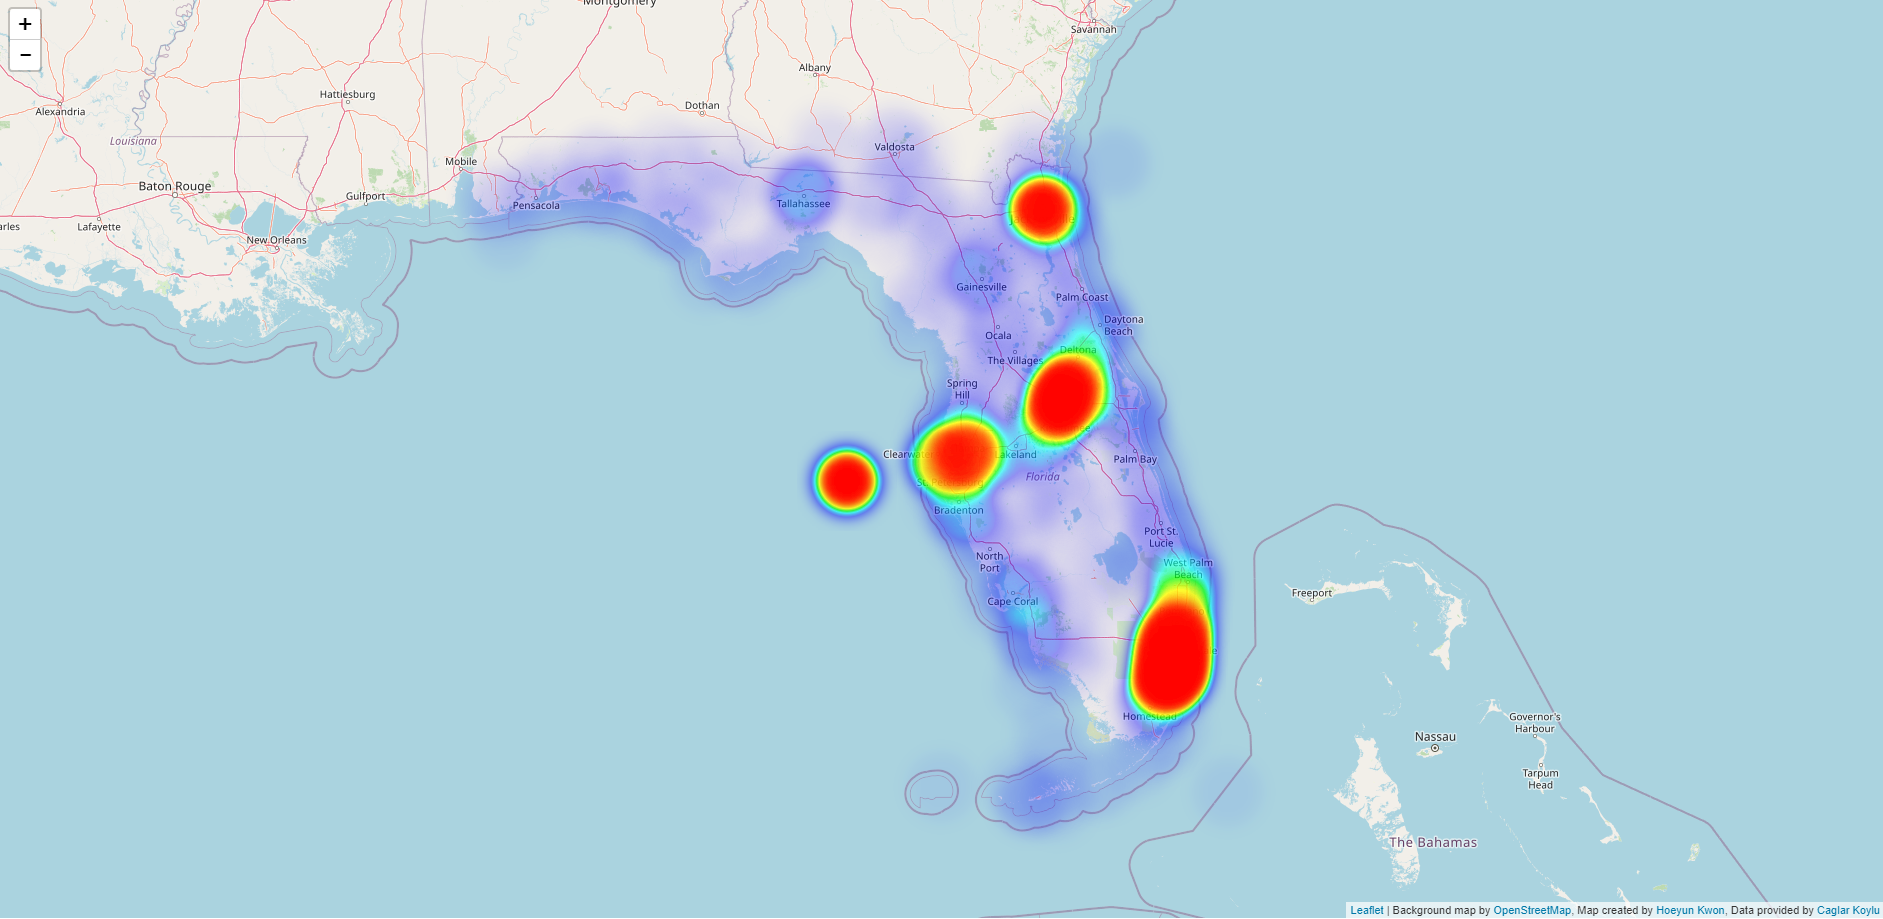
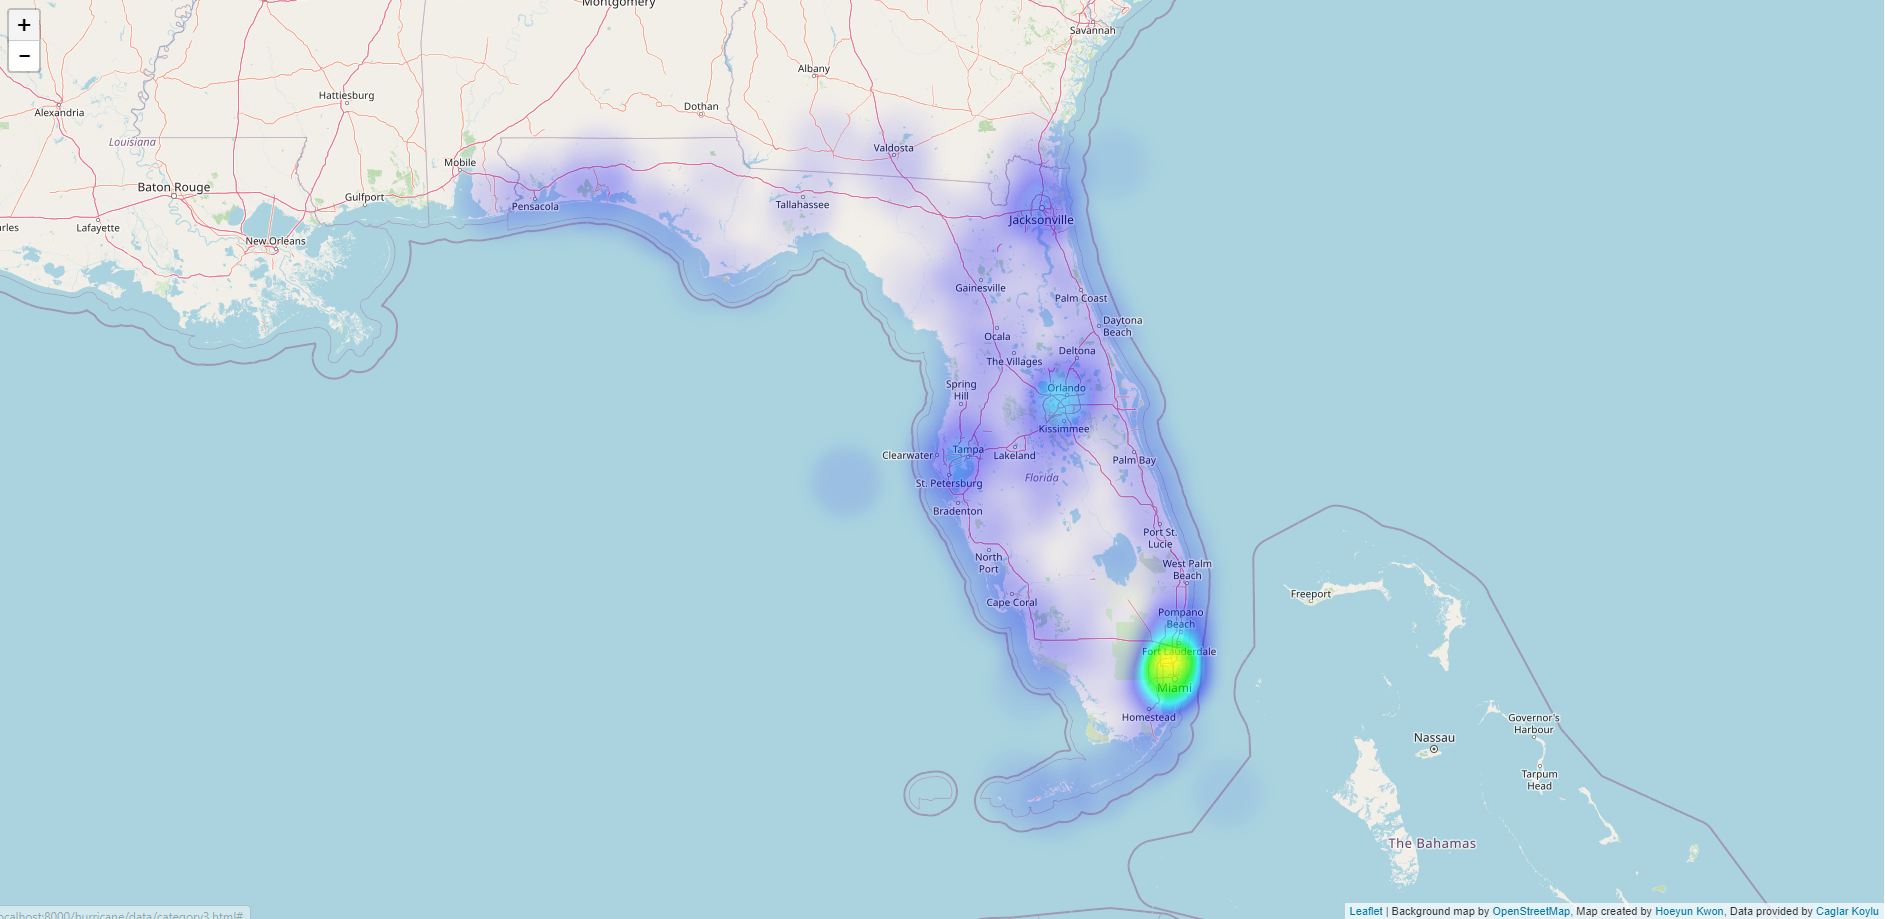
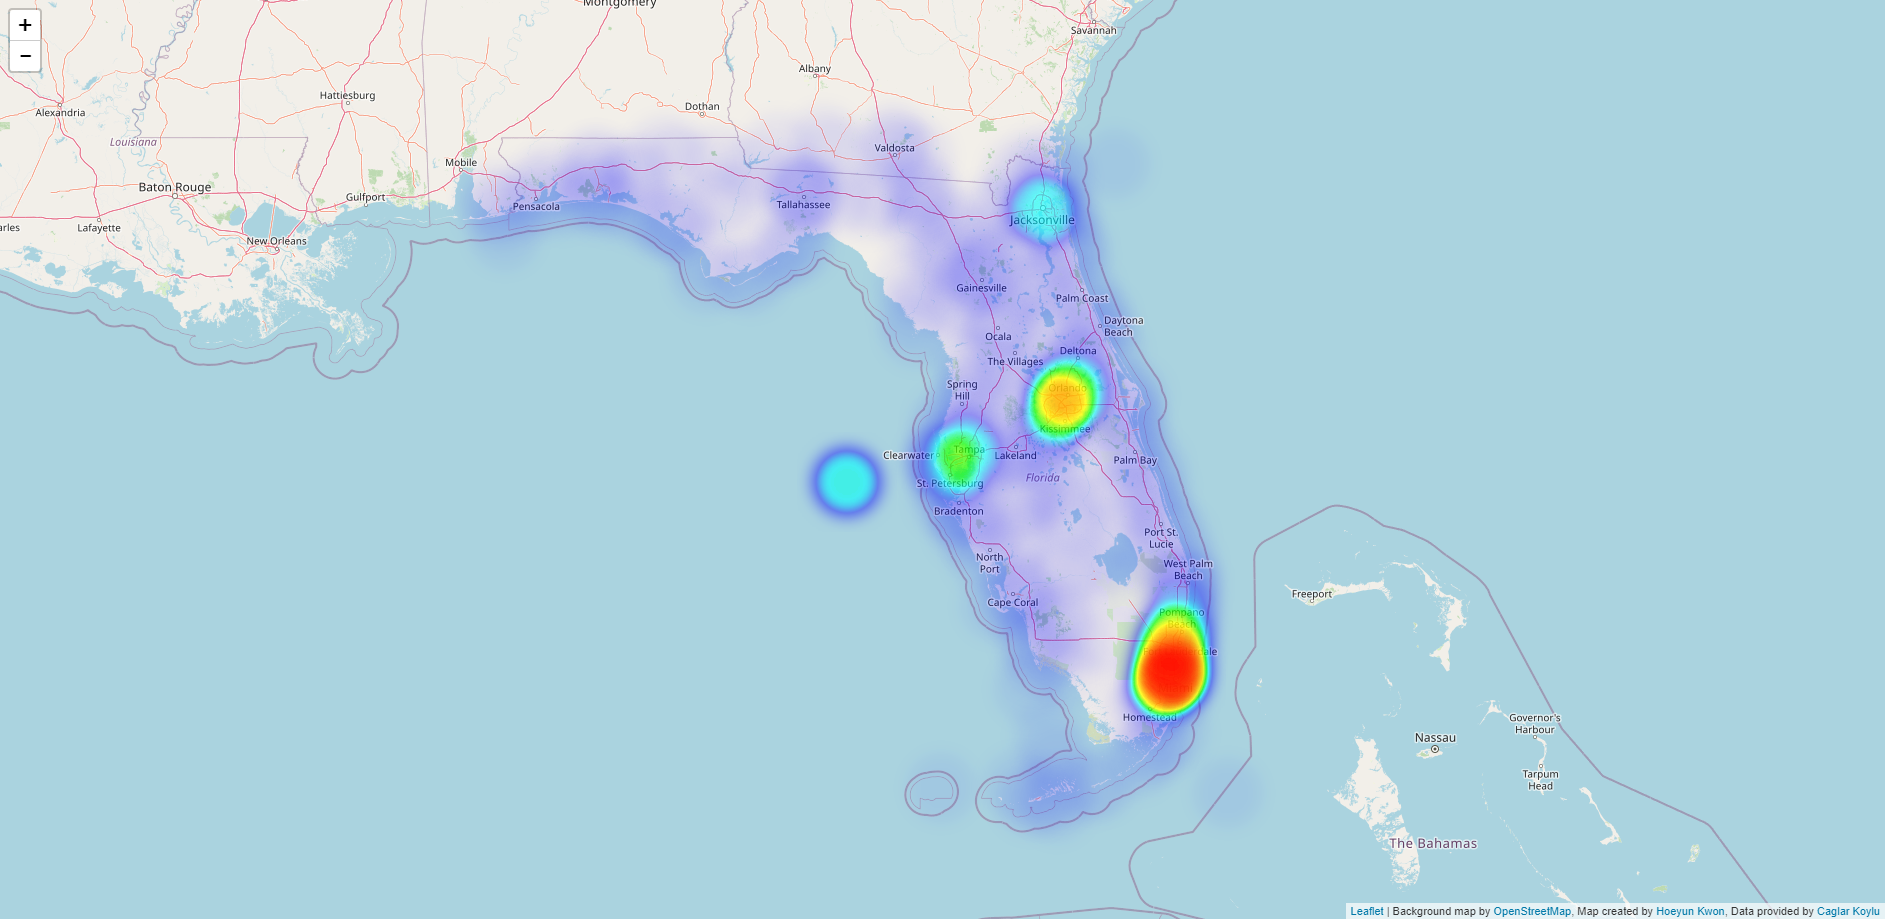
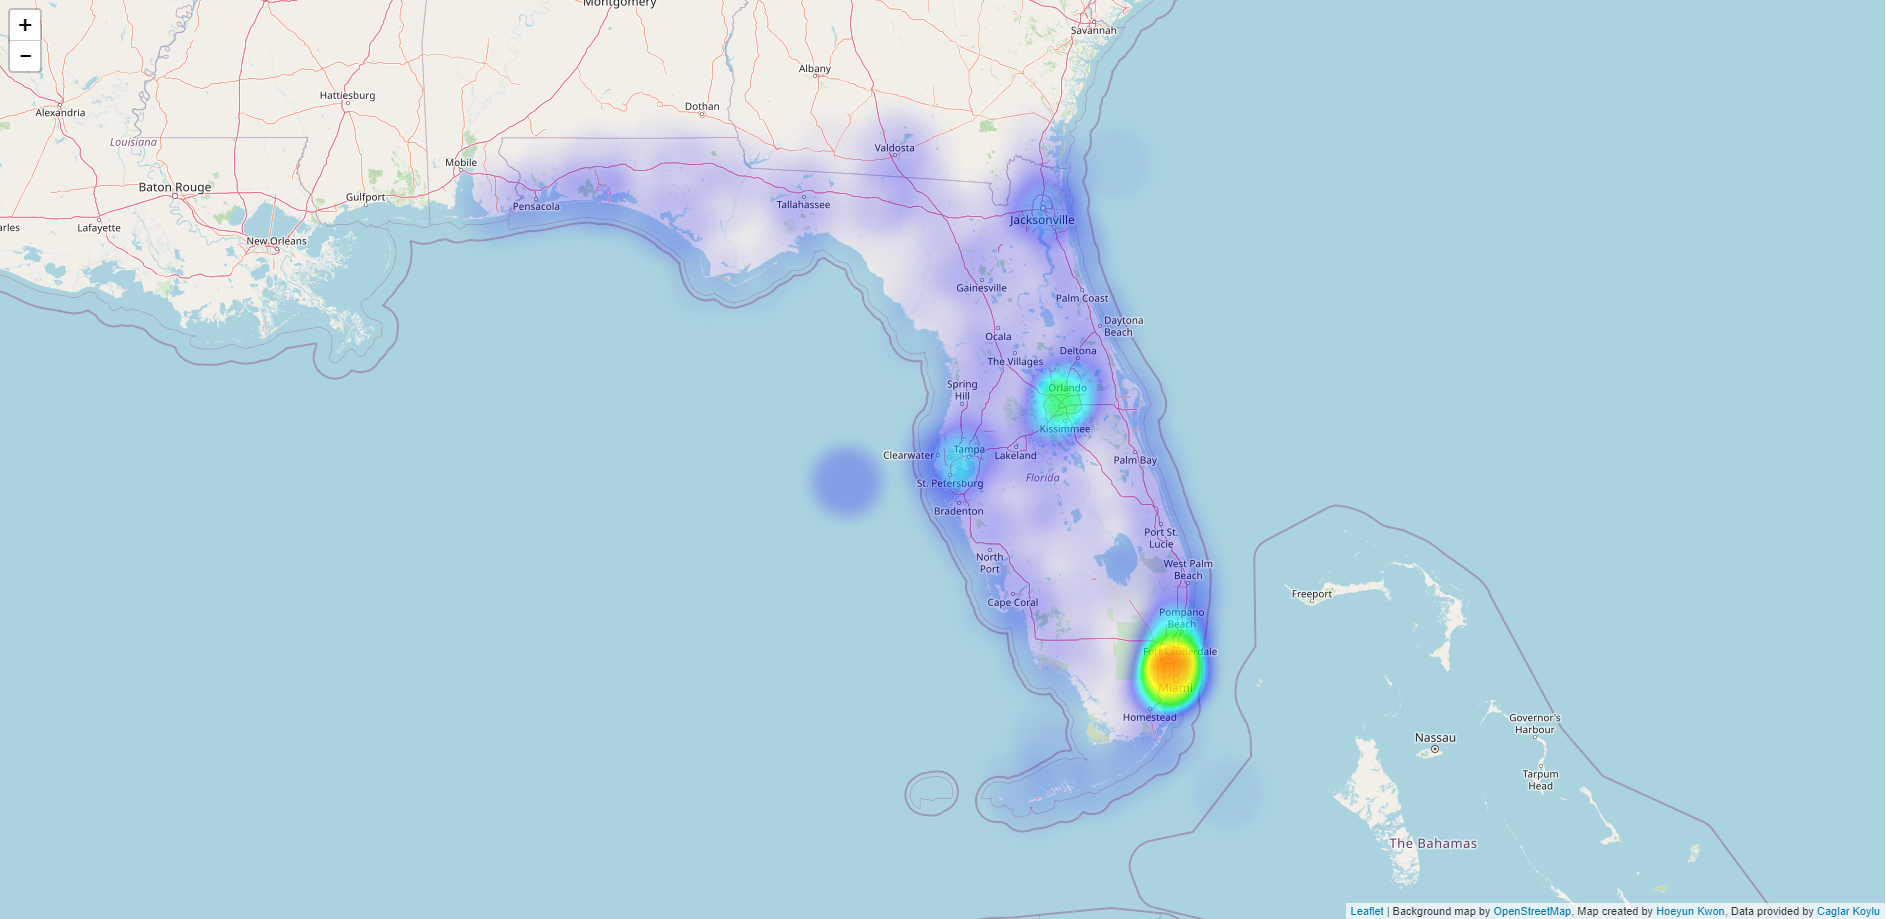
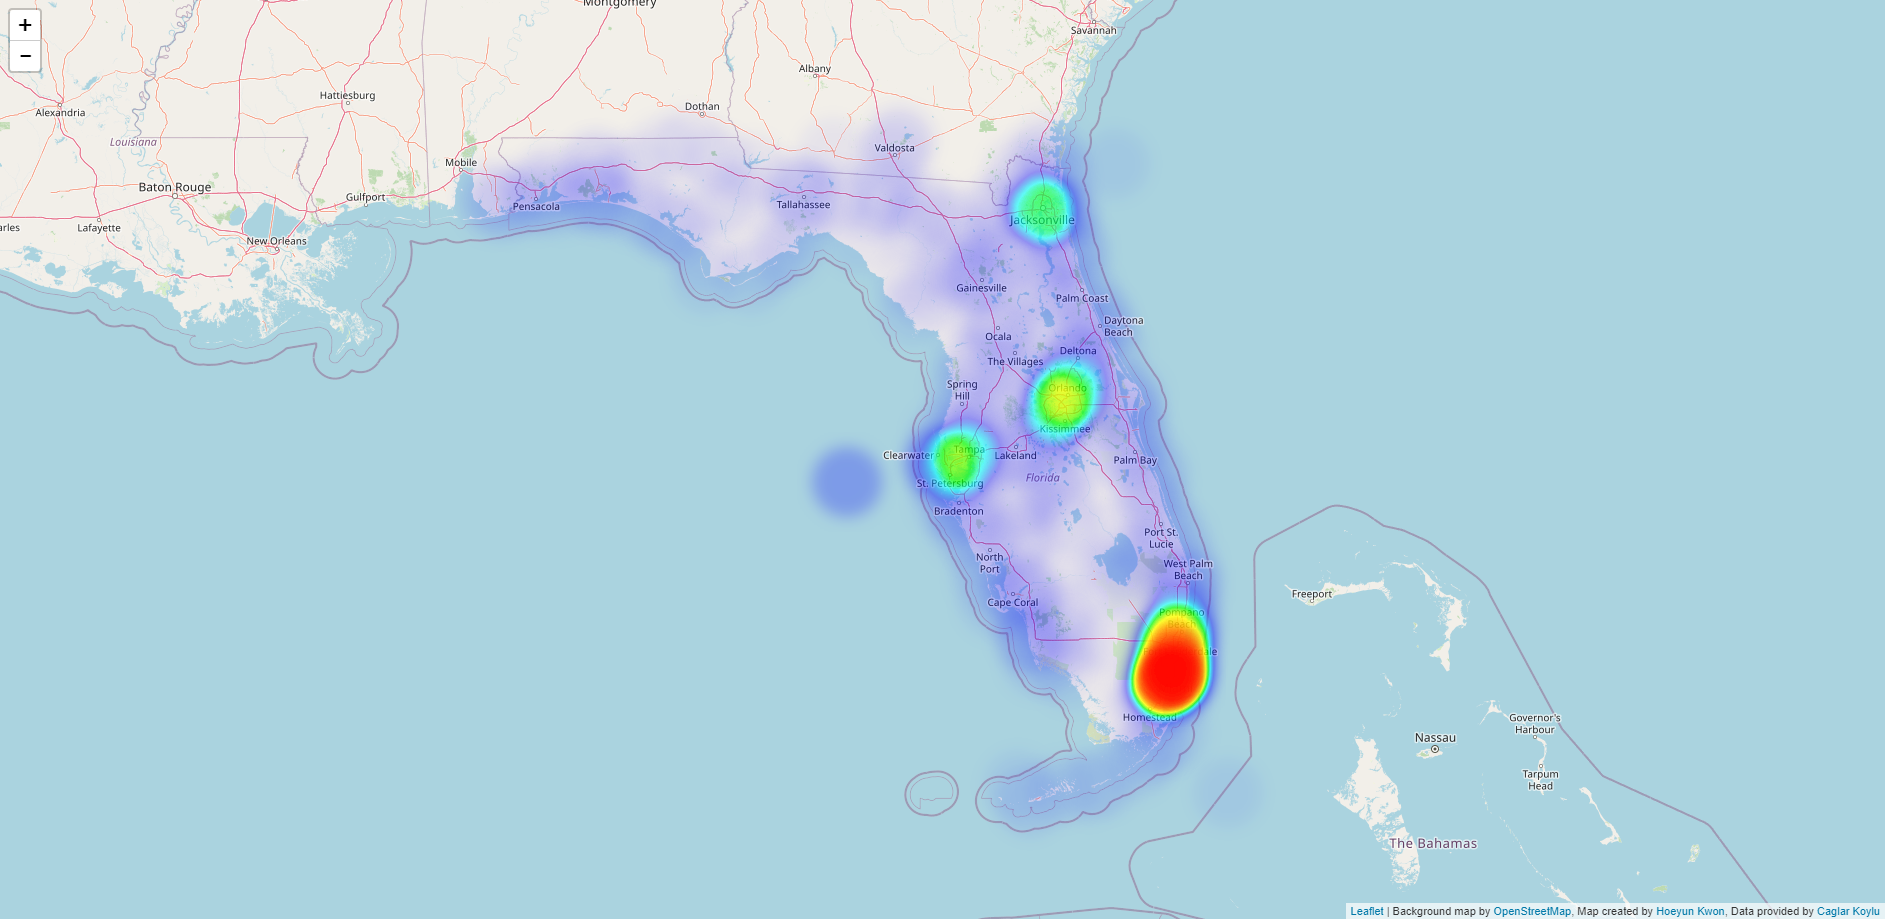
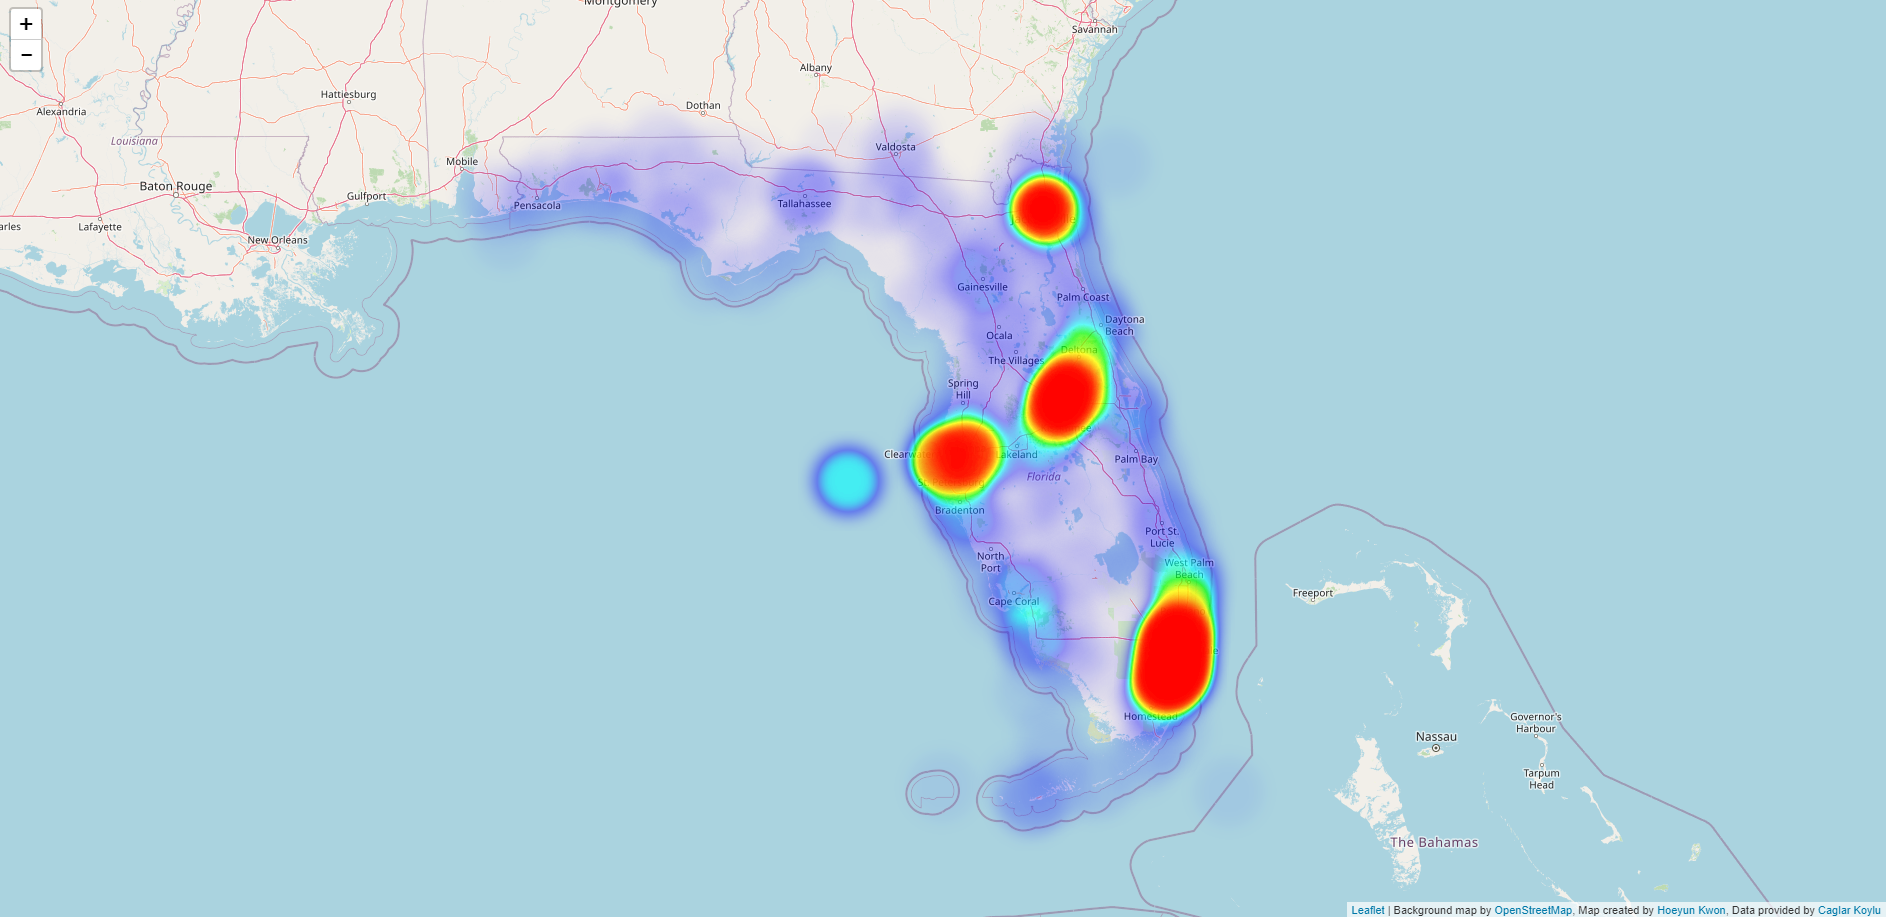
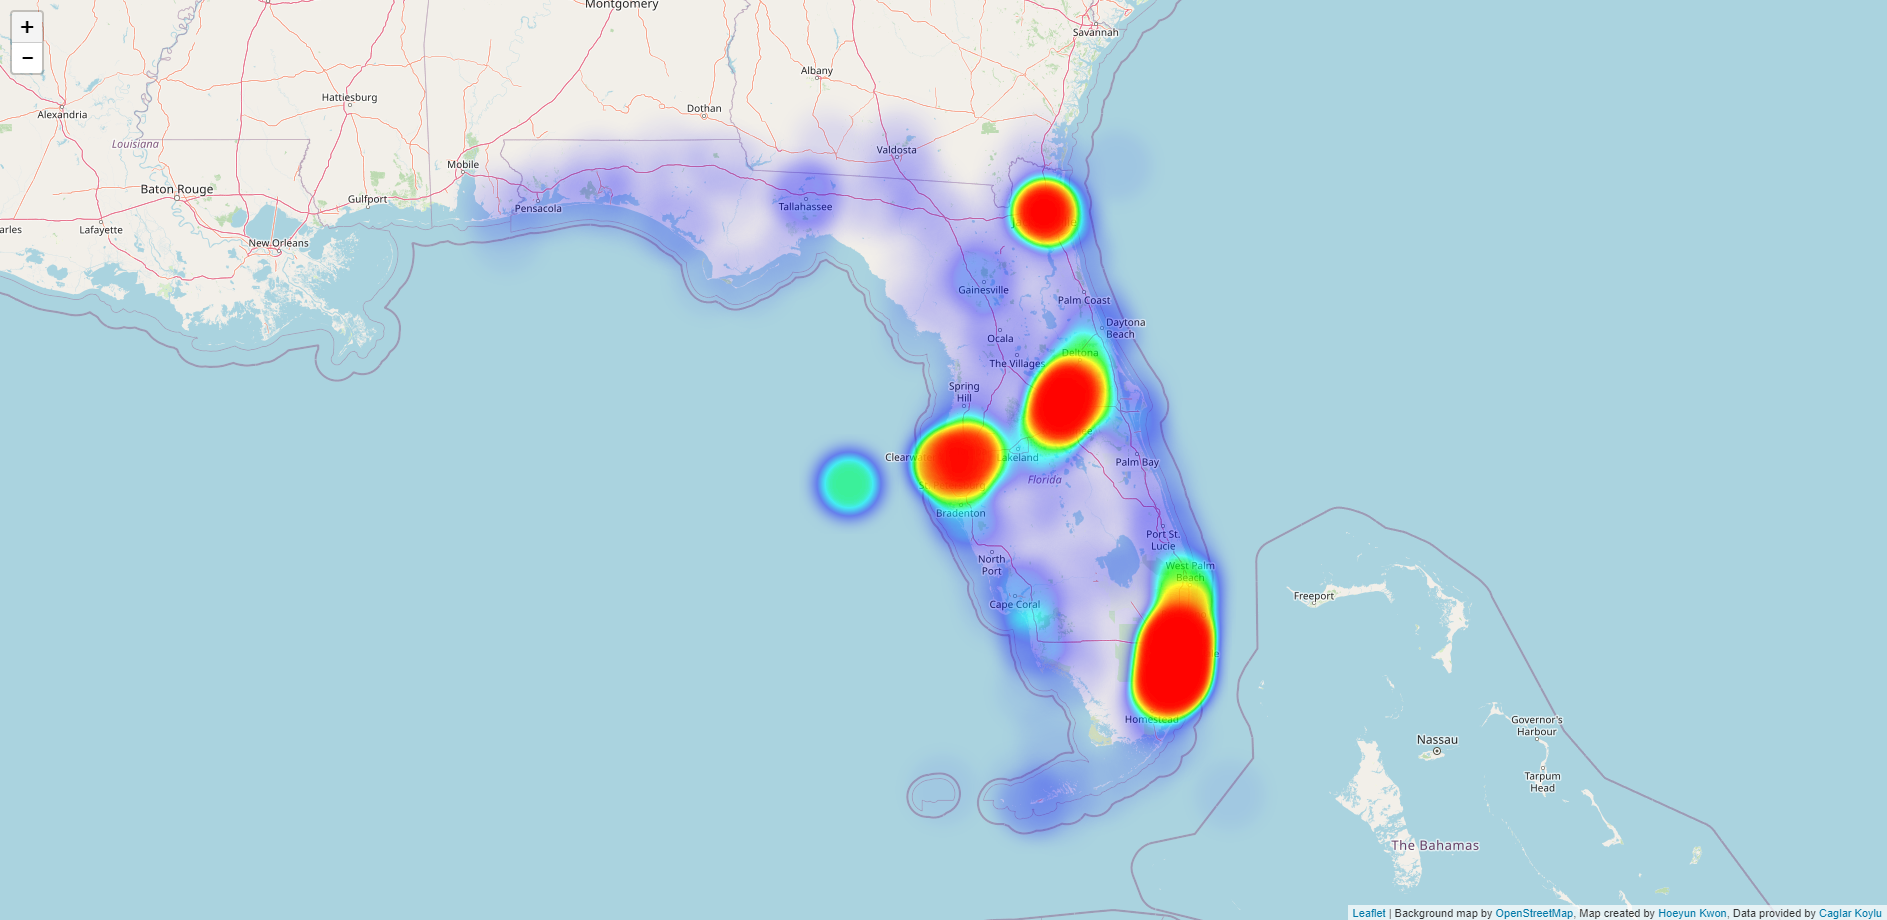
Heatmaps for each category
To see the spatial patterns of hurricane-related tweets, I created heatmaps for each category. Generally, the areas where tweets are concentrated are big cities
including Miami, Orlando, Tampa, and Jacksonville.You can go to the interactive heatmap by clicking each map below: