A Comparison of Yearly Optimized Hot Spot Analyses
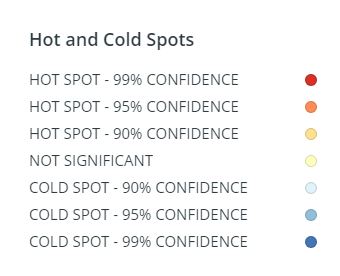
Each map on this page depicts the hot and cold spots created by running the optimized hot spot tool on wild hog locations with influenza A status as a binary variable. The hot spots displayed show, not just areas where pigs with influenza are clustered,but also where pigs without influenza area clustered. In addition, the cold spot are areas where pigs with and without the flu are clustered together. Each map is additionally shown with that year's wild pig density as a layer.
The data collected shows two different trends. First, in areas with high pig densities, there are statistically significant clusters of influenza pigs and unhealthy pigs. This is expected based on current knowledge of how pigs would pass an infectious virus to each other. More curious is the second trend. It shows a number of area with high pig-density where sick and healthy pigs are clustered together. There could be a number of different reasons for this, the most concerning of which is that these pig populations are being infected from outside sources such as pig farms or migratory birds.