SatScan - Spatiotemporal Clusters of Influenza using a Poisson Distribution
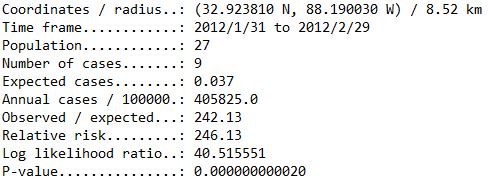
This map shows two different sets of variables. First, it displays the kernal density map created from all wild hog samples. This gives a general understanding of the places in the US pigs (or at least samples) are most prevalent. This density is important when considering where clustering may occur. Second, the SatScan program used a poisson distribution to calculate spatiotemporal clusters of influenza A cases in the feral swine population.
These clusters, while not numerous, are important. Specifically, because these clusters provide ample evidence that even with their relatively solitary natures, pigs populations are capable of infecting each other on a scale which is significant. More research needs to be done concerning distributions of influenza A in feral swine populations, but this analysis provides a direction with which to begin.
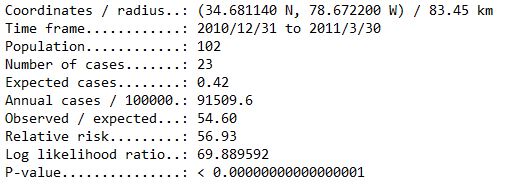
Cluster 3
Cluster 3 only contain 23 cases, but occured near the border of Mississippi and Alabama. While small, it was also very dense, with 23 cases occurring in 9 km over a month.