Spatial Attribute Analysis of the Data
This section reveals the descriptive data analysis done to gain a general understand of what types of analysis were needed. On completion, it was obvious that spatial and temporal clustering analysis was needed at the very least.
Influenza Rates - Overview
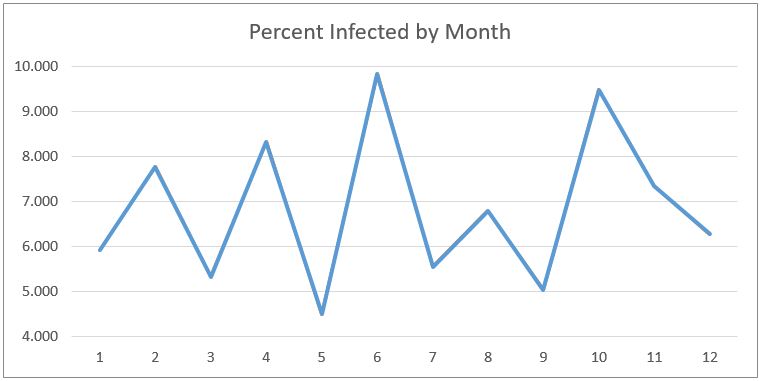
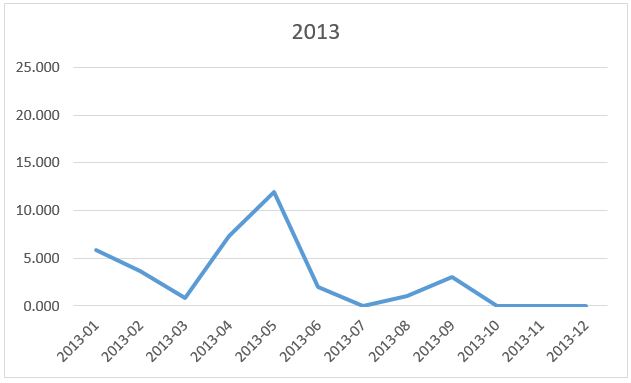
As you can see, the rate of infected individuals did vary by year, but not significantly. The only outlier is 2013, but seeing as 2013 wasn't a full year of data collection, this could be the result of seasonal variation. Unfortunately, this chart tells us very little besides a general idea of the infection rates. The monthly distribution was equally meaningless, except to show that there isn't a consistent seasonal variation in rates.
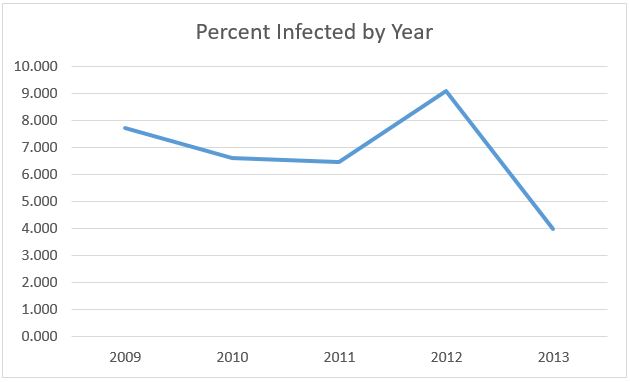
Distribution of Influenza Rates by Year
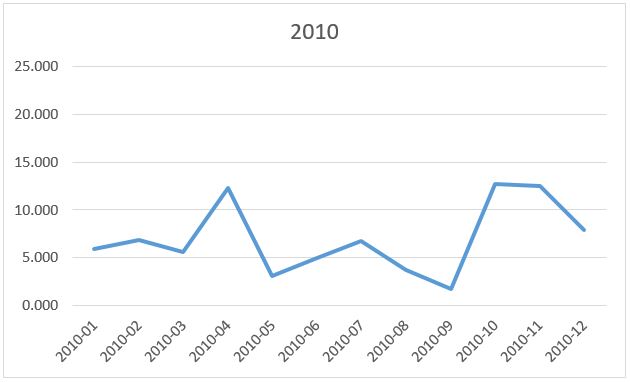
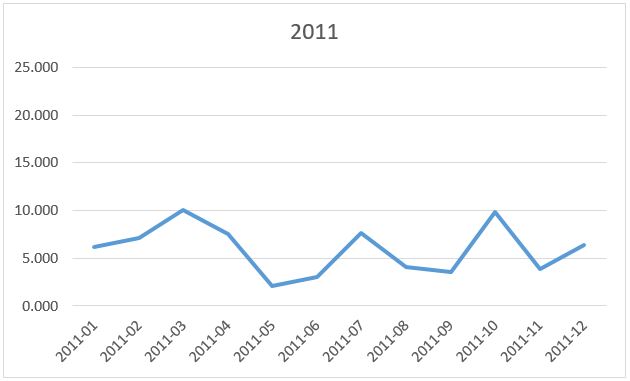
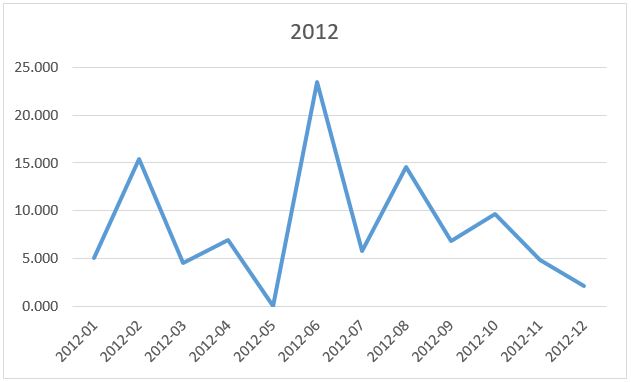
The comparison of monthly infection rates by year gives us more data than the previous analysis, however none of the trends are consistent. What this potentially implies is that climatic variation in the US has very little impact on influenza A infection rates in pigs. This is significantly different than in humans.
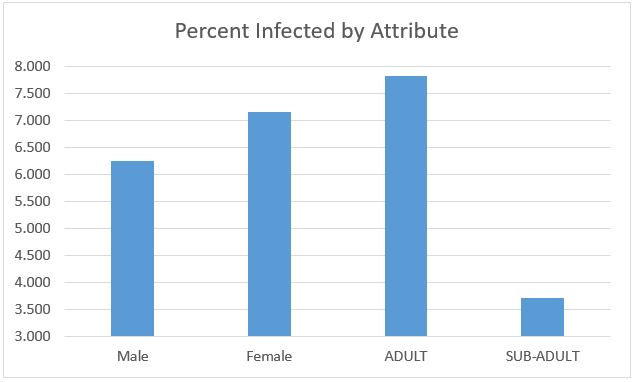
Distribution of Influenza Rates by Attribute
Looking at the infection rates for different hog attributes gives us an idea of which sub-populations are most at risk. This first comparison is Male and Female and as you can see, there's not much variation. Females are slightly higher, but that could have just sampling error. However, the Adult and Sub-Adult populations are significantly different. While I don't have any evidence to back this up, there could be a certain immunity factor passed on by mothers to their young that dissipates as the pigs get older.