Geographic Visualization Portfolio GEOG:3540
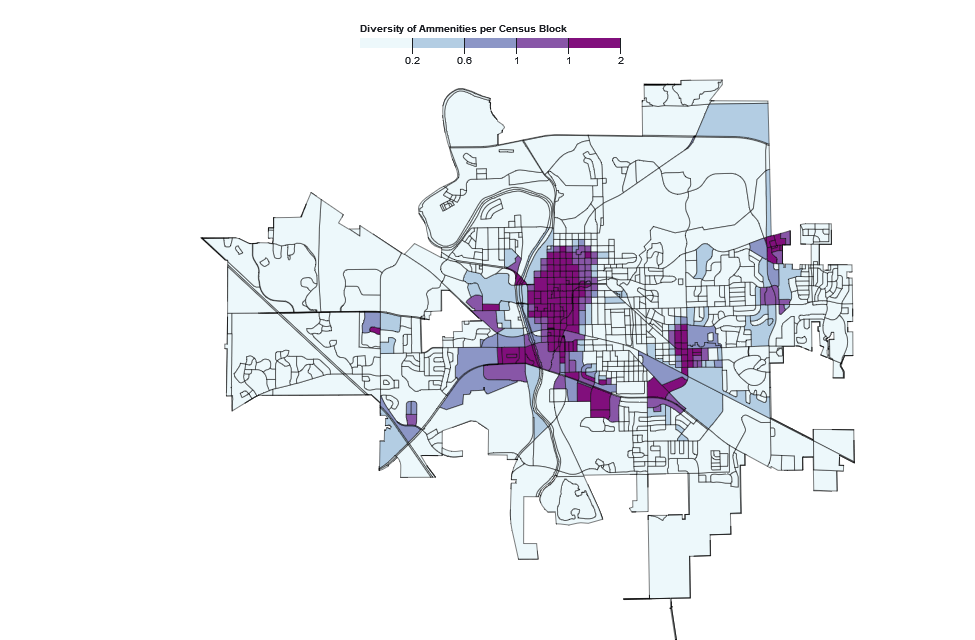
Diversity of Iowa City
A Choropleth map made in Observable Notebook. In the map, I used point of interest nodes and census block data to calculate how diverse each block was.
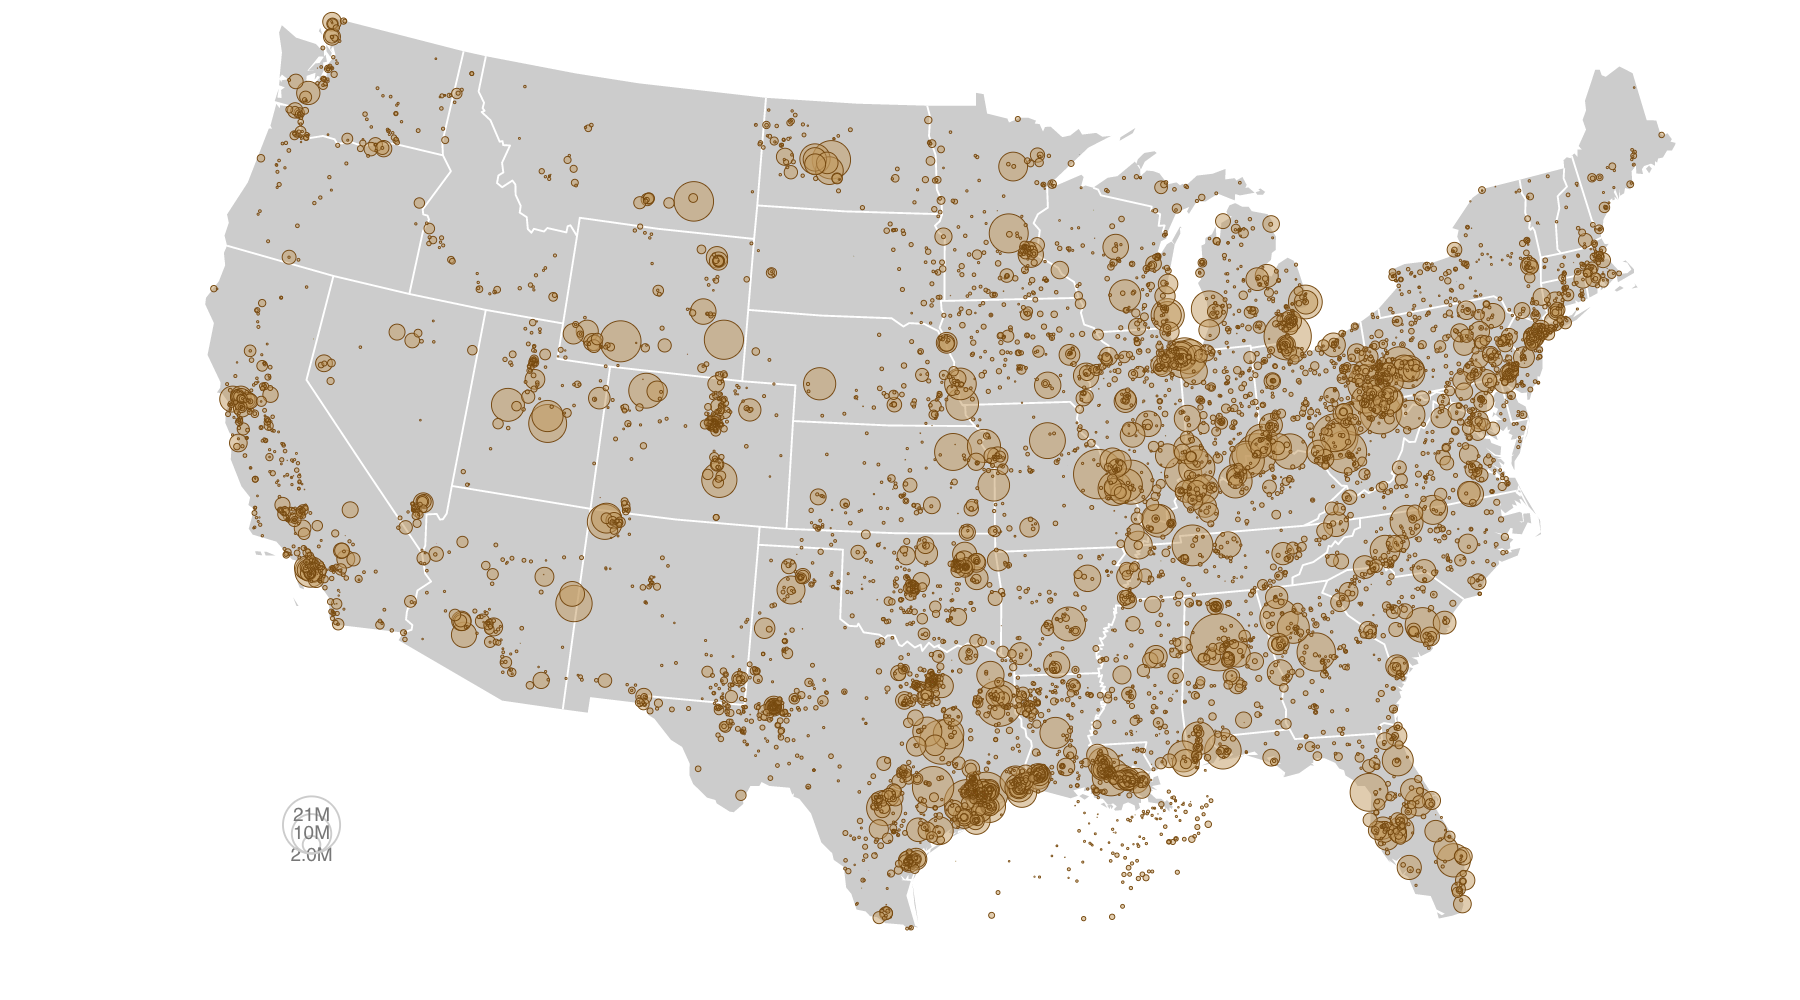
Greenhouse Gas Emissions by Source
A map of the United States showing point source greenhouse gas emissions in tons of CO2. The data is from the EPA and US census.
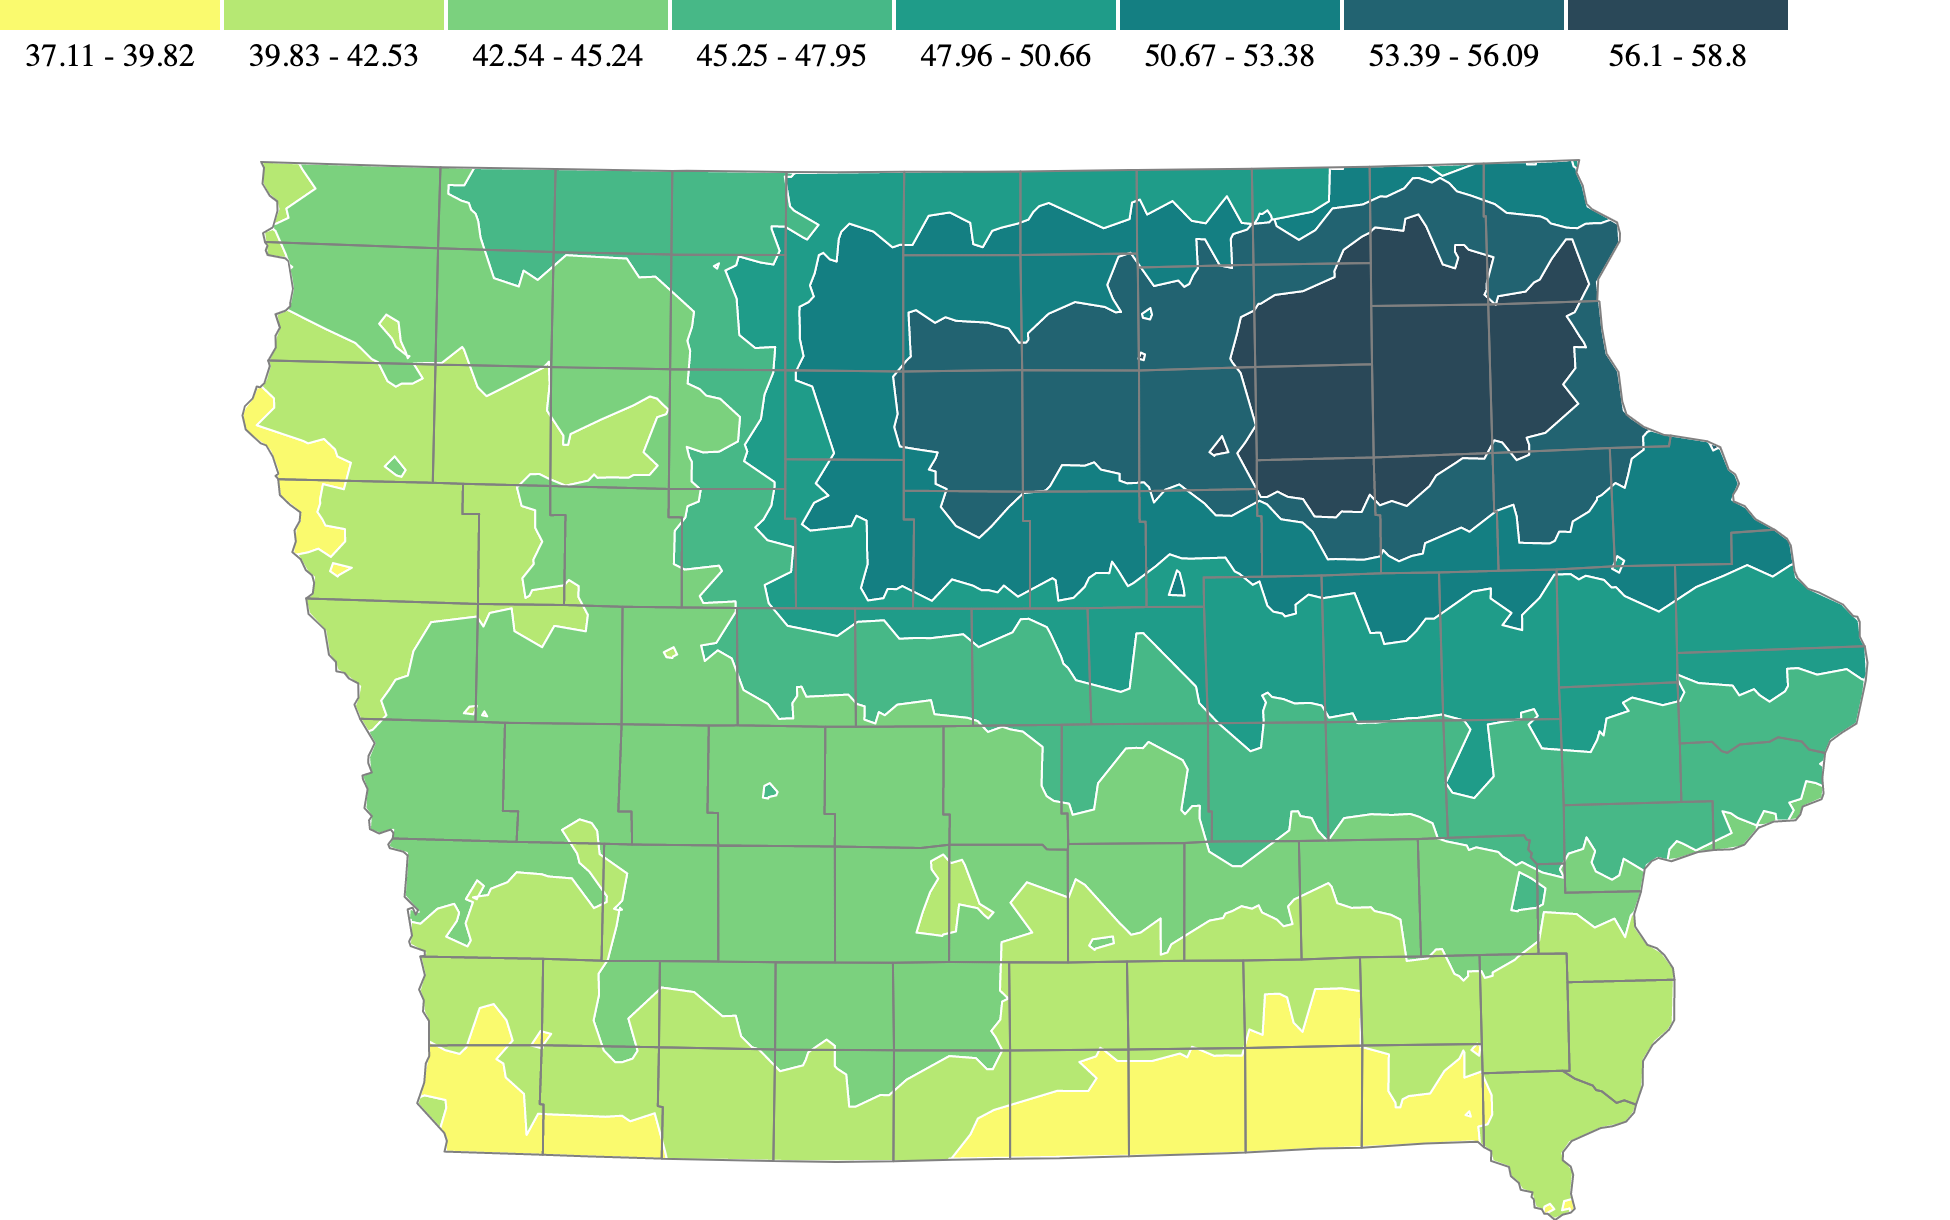
Precipitation in Iowa
Precipitation throughout Iowa in 2018. This isarithmic map was made using data gathered from the Iowa State school of agronomy.
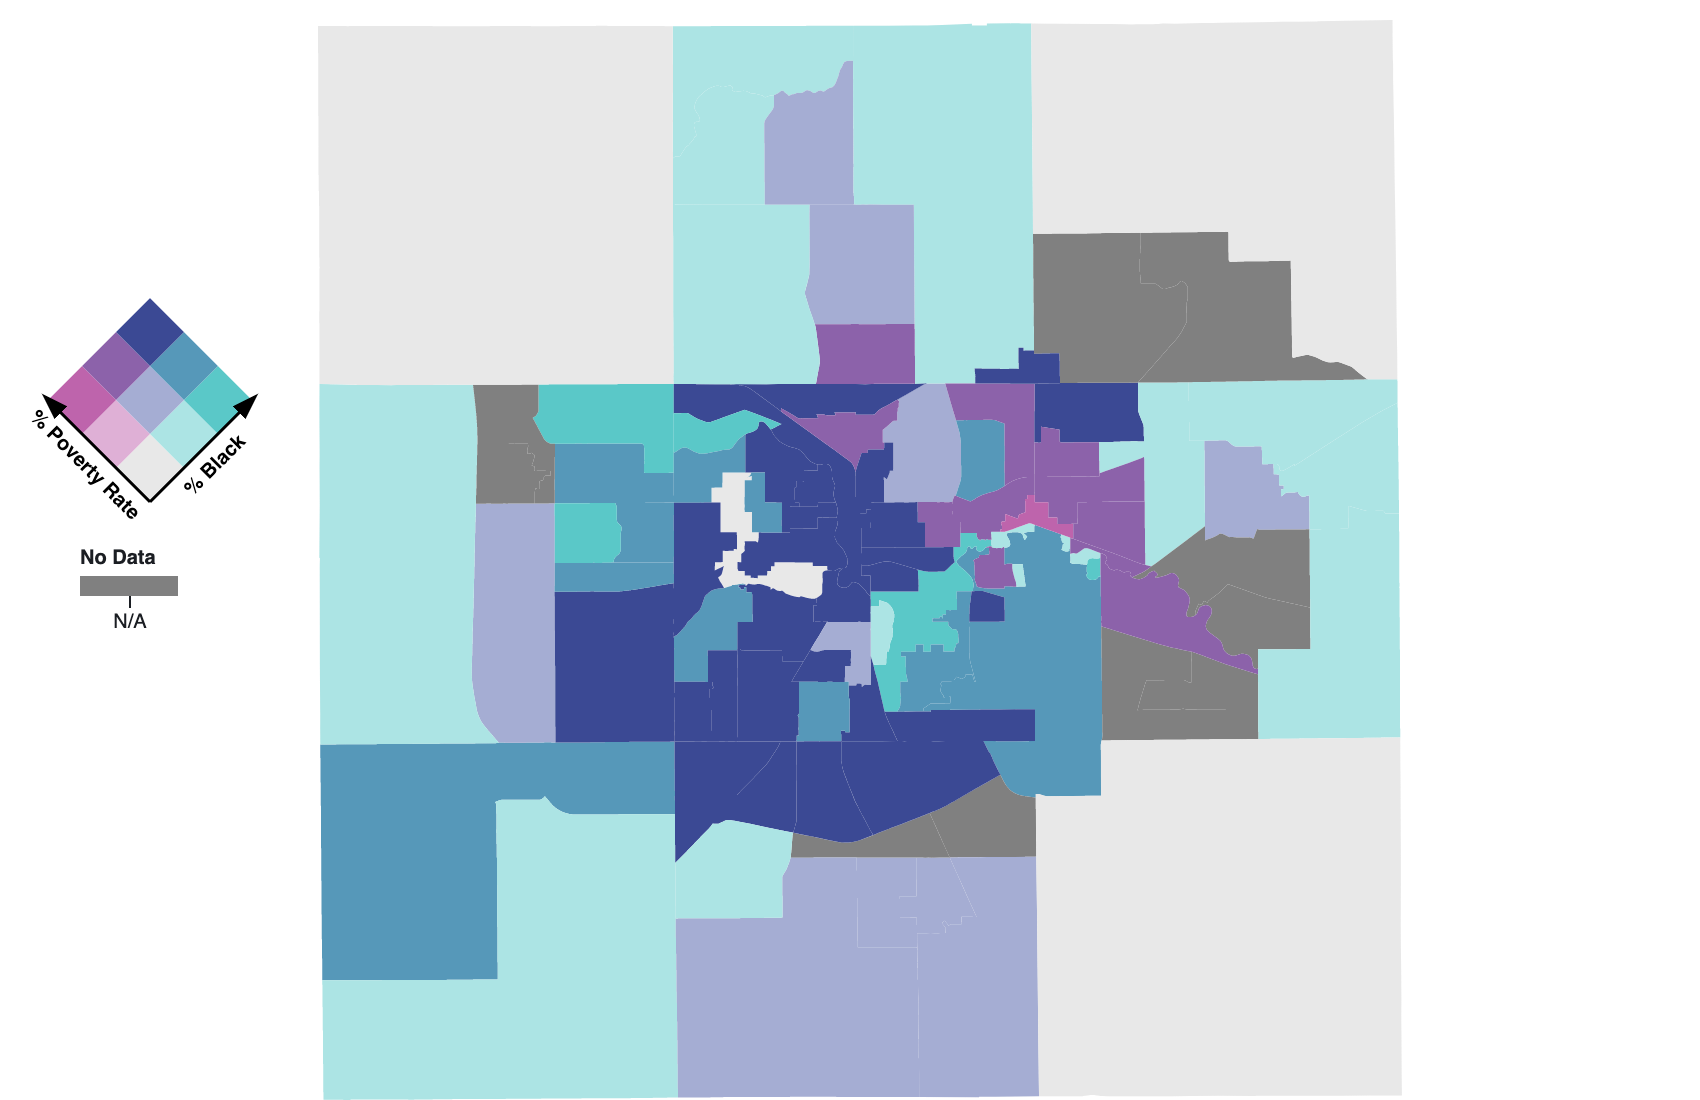
Comparing Poverty and Race
This is a Bivariate map of Lansing Michigan and surrounding townships. It is comparing the poverty rate and percent of the population identifying as African American.
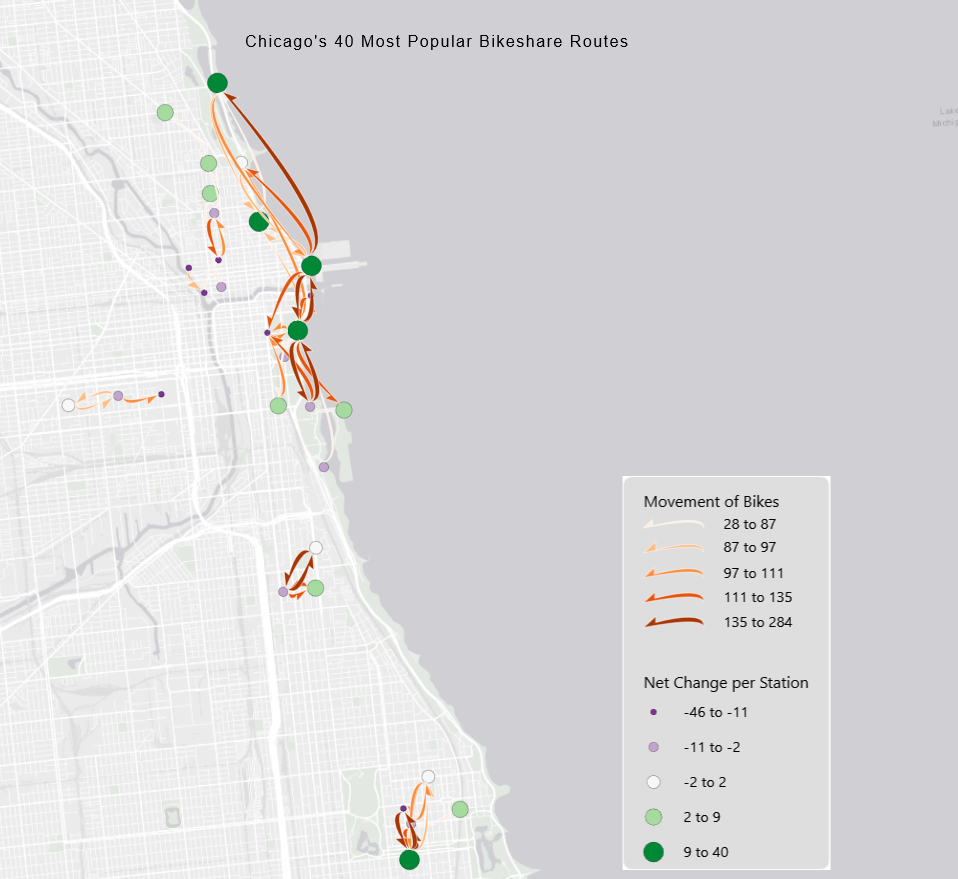
Flow of Bike Share use in Chicago
Using Flow Mapper, I visualized the 40 most popular Bikeshare routes in Chicago.
Different Amenities Around Iowa City
The differences in the distribution of amenities in Iowa City can be highlighted using a small multiples visualization

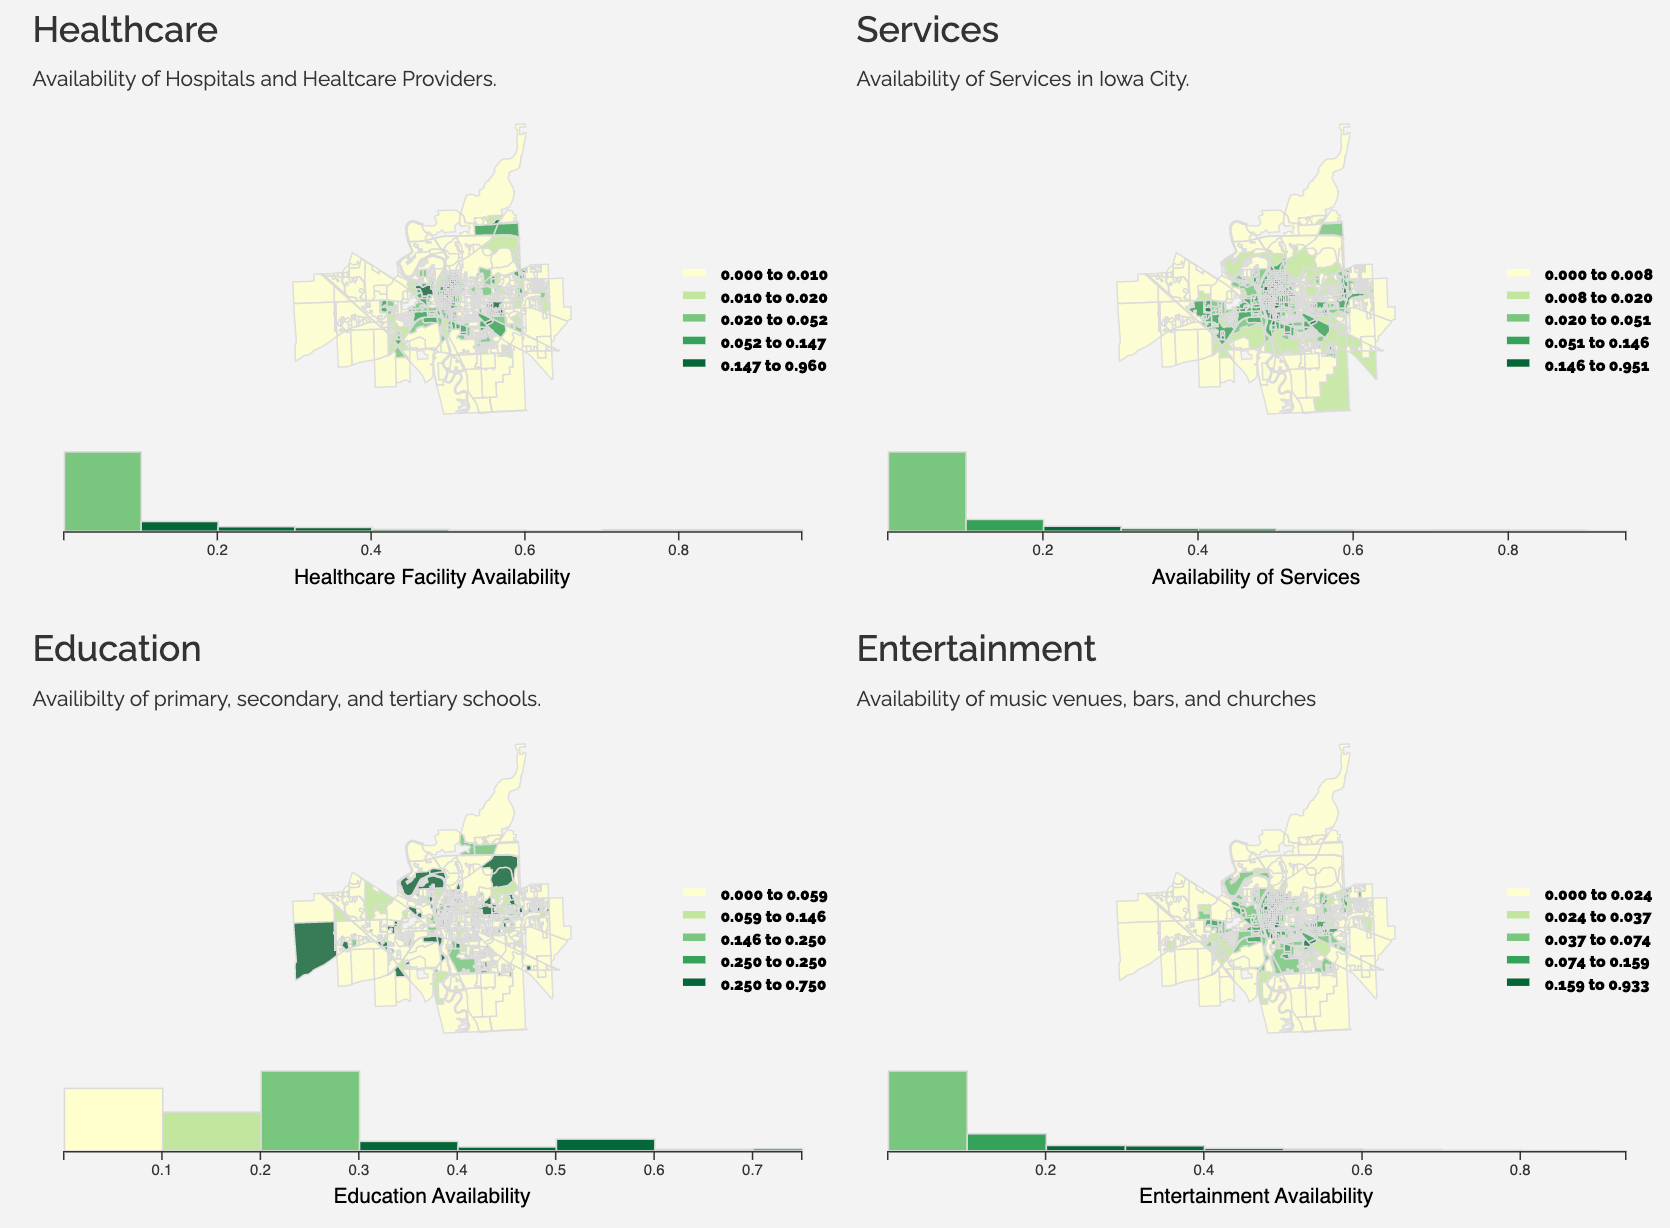
Accessibility of Amenities in Iowa City
The accessibility of Iowa City's amenities showcased using various visualization types.