GEOG 3540 Introduction to Geographic Visualization
Course Description
From ancient maps of Babylon, to an interactive map of the planet Mars, people have used maps as analytic tools to navigate their way and explore various geographic phenomena. Drawing from the interrelated fields of cartography, information visualization, and human-computer interaction, this course introduces the basic concepts and techniques that underlie cartographic representation and interaction and the broader field of geographic visualization. Selected topics include cartographic principles (e.g., data classification, color and symbolization), mapping techniques, interactive cartography, animation, and multivariate mapping. Weekly lab assignments are designed to provide practical skills to implement effective open-source web-based visualizations using CartoDB, JavaScript, and visualization/mapping libraries such as D3 and Leaflet.
Learning Outcomes
Example Student Projects
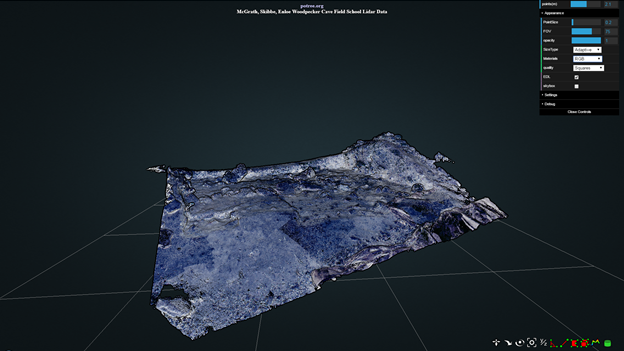
Woodpecker Cave Potree Viewer
The purpose of this project is to build and constantly add to an online viewer for the Lidar data from the Woodpecker Cave Archaeological Field School run by Dr. James Enloe of the Department of Anthropology at the University of Iowa. The goal of this project is to act as an example for Anthropology departments to use to openly share their site data.
Coordinated Views for Exploring Crime
Coordinated views enable interactive analysis of multivariate crime data for the state of Massachusetts.
Visualizing Flu Spread
Animated map illustrates the first positive flu test done by each facility. It runs through the flu season, each location lighting up as soon as it performs the first test.
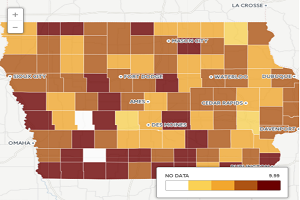
Lung Cancer, Health Factors and Demographics
The purpose of this project is to understand the relationship between lung cancer deaths, health factors and demographics.
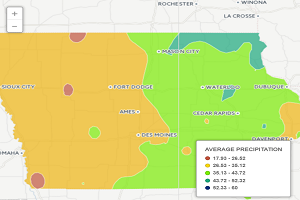
Change in Total Precipitation between 2012 and 2015
The purpose of this project is to map the change in total precipitation in Iowa between 2012 and 2015
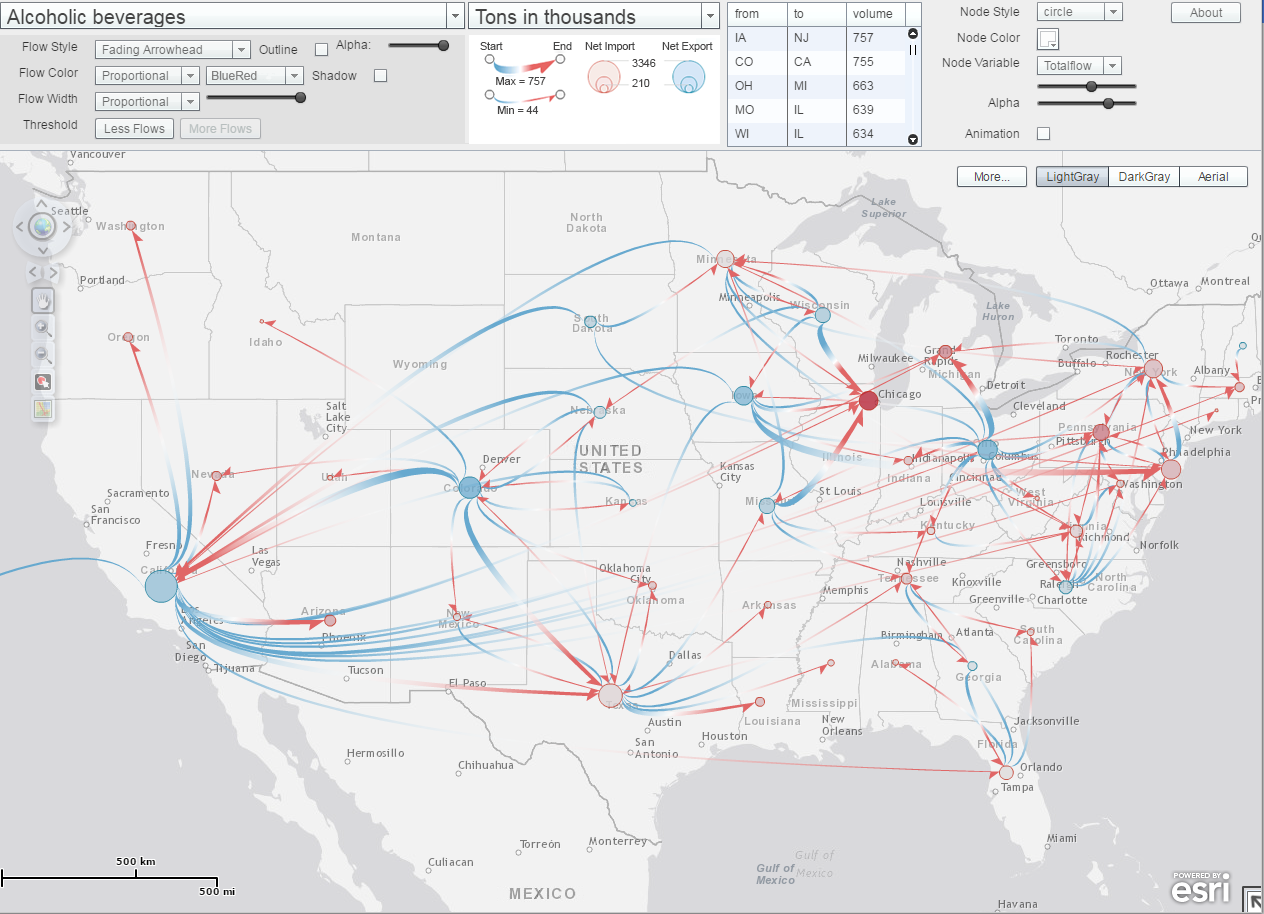
Flow Mapping
Both physical and intangible phenomenon such as people, commodities and information constantly move in the geographic space and create location-to-location networks (graphs) that are often referred to as spatial interactions. Flow maps are commonly used to visualize spatial interactions and facilitate the understanding of patterns of spatial flows and the corresponding spatial context.