Algae Attack: Milford Creek Phosphorus Loading
An Applied Research Project
Abstract
This project combines geospatial analysis of public data and local water quality data to evaluate results of a nearly twenty-year-old watershed plan. A 2007 total maximum daily load (TMDL) for the lower reach of the Milford Creek watershed cites excessive amounts of algae present in the stream leading to violations of the state’s water quality standards for dissolved oxygen related to diurnal fluctuations. Suggested water quality improvements include “significant” reductions in phosphorus loading from point and nonpoint sources including agricultural and urban land use.
This project incorporates the Source Load Assessment & Management Model (SLAMM) in an ArcGIS interface to estimate pollutant load from urban areas and compare results with 2005 data. Dissolved phosphorus measurements from the time series were also compared with sample data from 2021 and with data from a watershed under similar conditions in central Iowa.
Results indicate an increase in both urban and agricultural land use, particularly from 2008-2011. SLAMM modeling data produced a comparatively different output than models designed to estimate pollutant load from agricultural land use only. By combining these models, this study provides a more complete assessment of actual conditions in the watershed both historically and at the present time.
Background Information
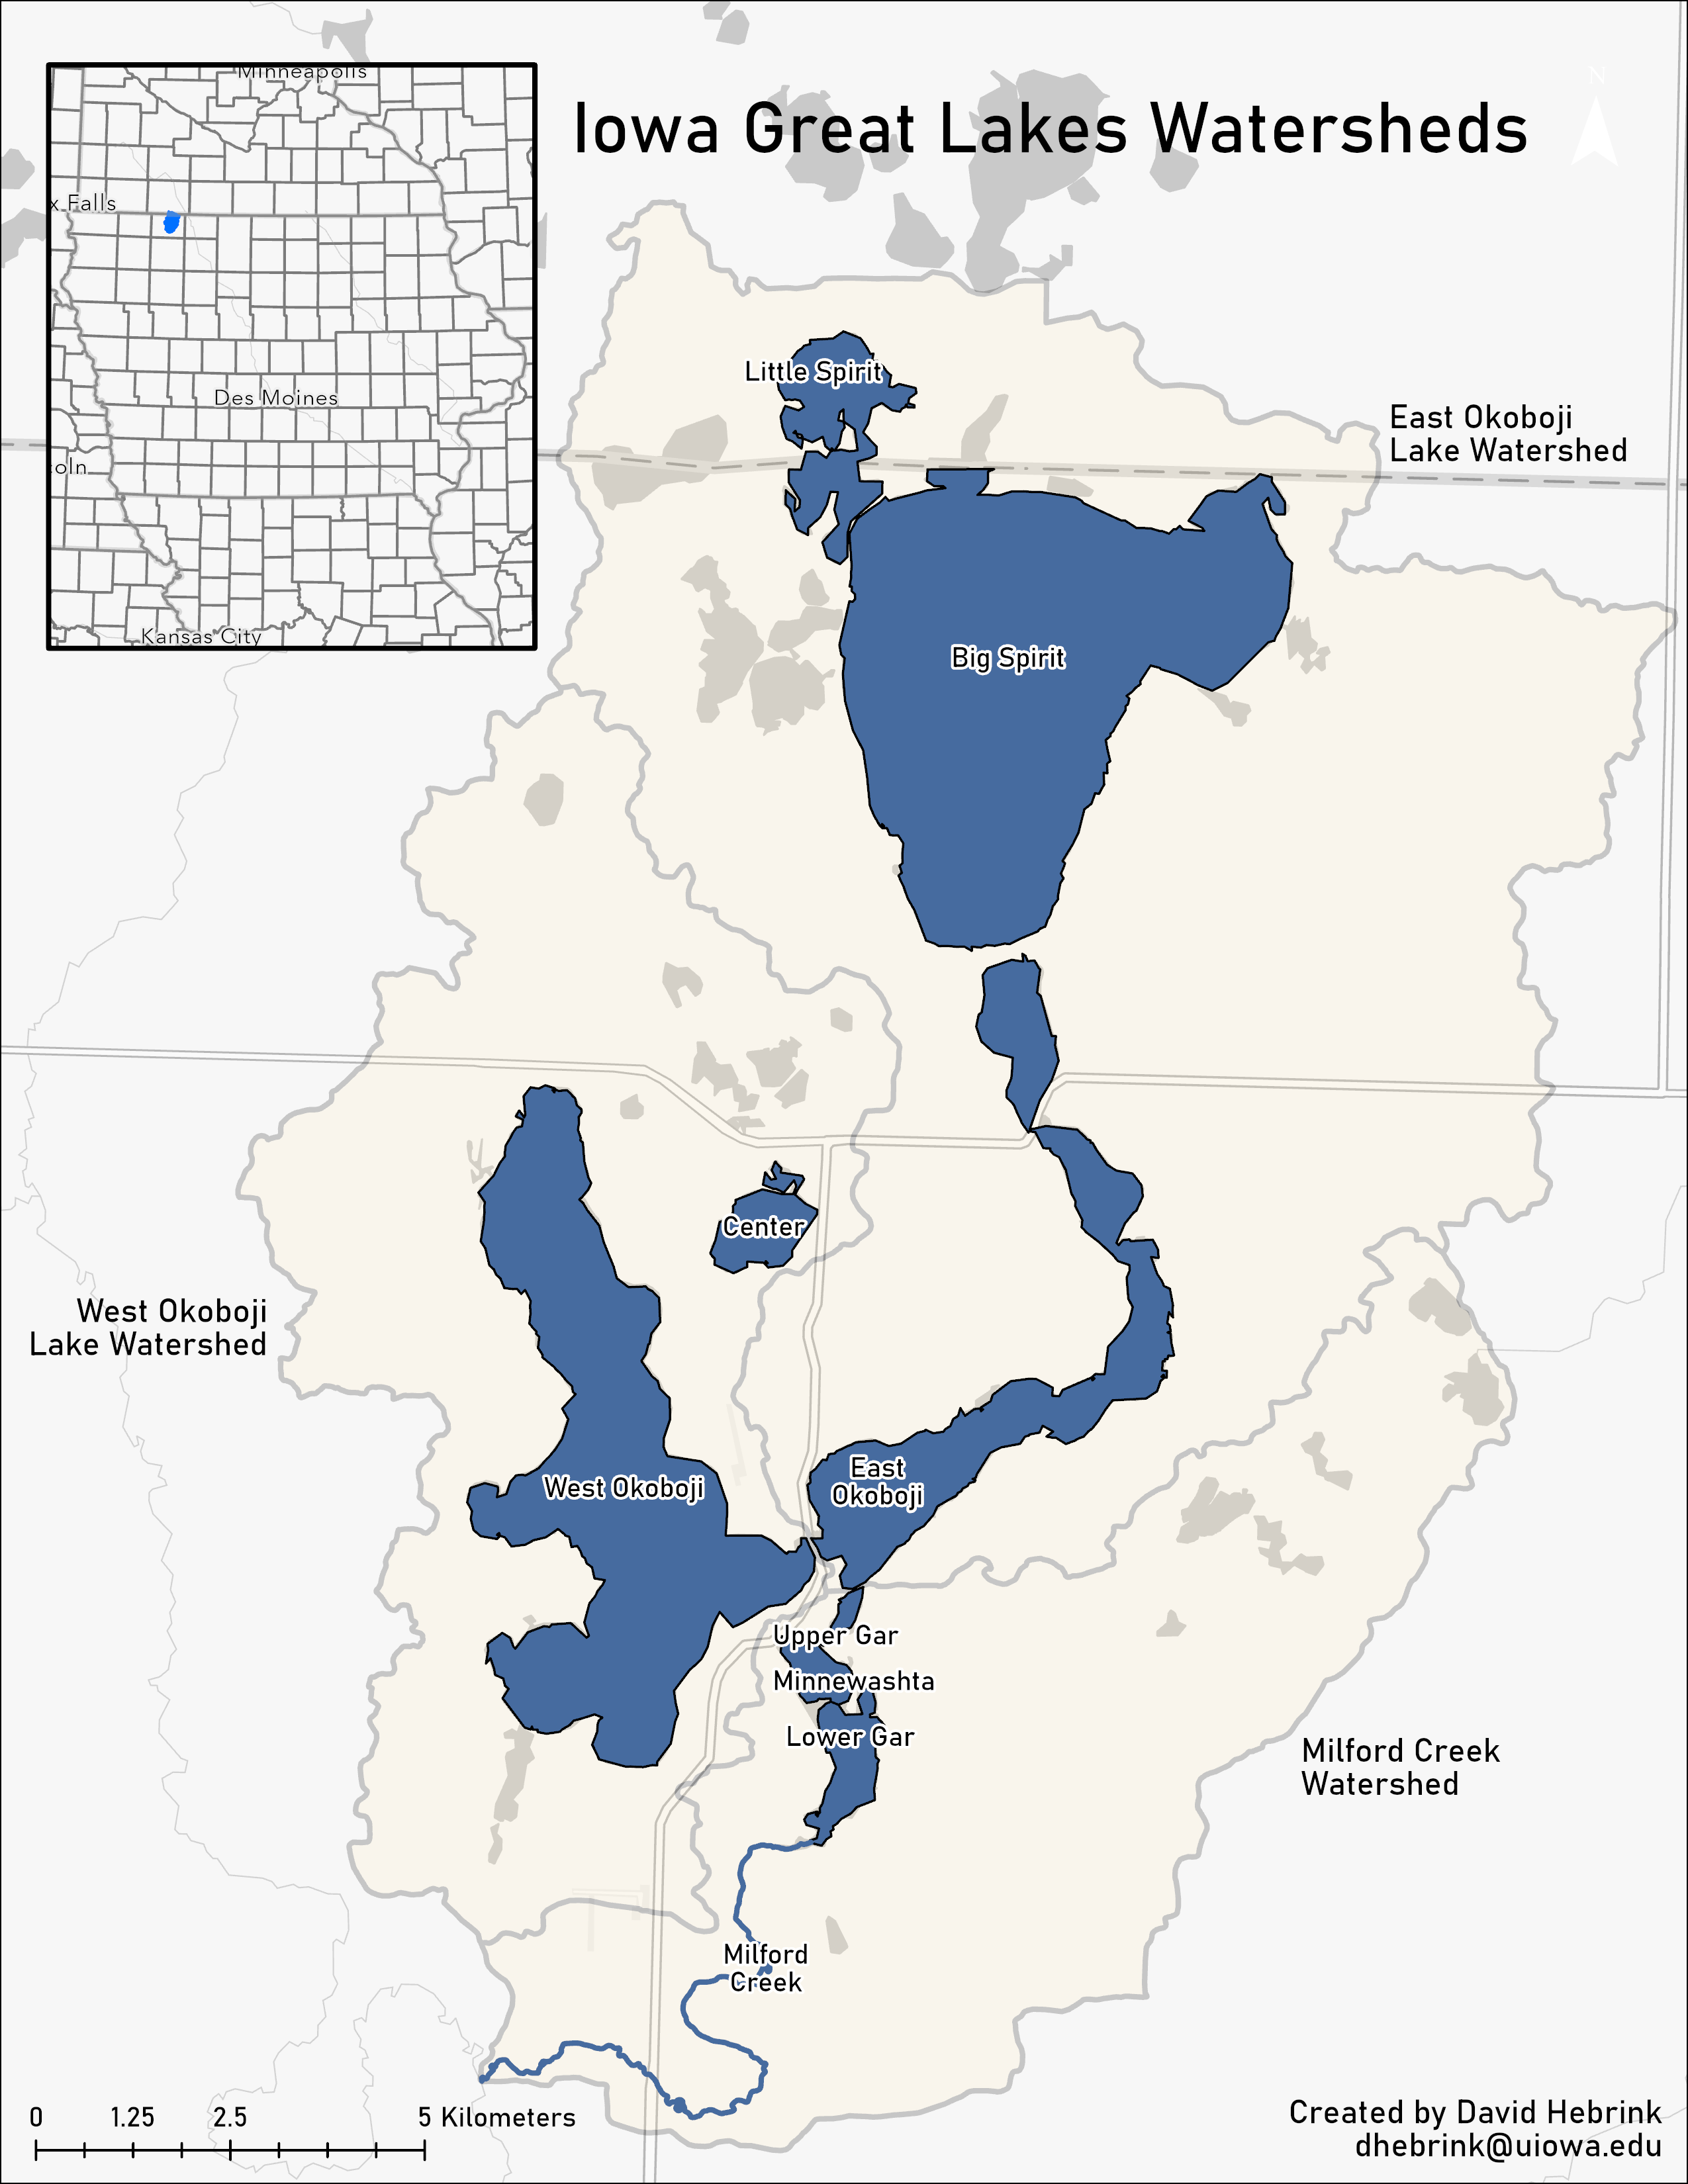
Milford Creek is a 6.2-mile-long stream running from Lower Gar Lake south and west, skirting the edge of the town of Milford, IA (IDNR, 2007). Milford is situated at the southern end of the chain of the Iowa Great Lakes, including the waterbodies of Upper and Lower Gar, Minnewashta, East and West Okoboji, Big and Little Spirit, and other lakes. Lower Gar Lake is the lowest lake of the chain, with a low-head control structure separating it from Milford Creek. The Iowa Great Lakes Sanitary District (IGLSD) wastewater treatment plant (WWTP) discharges treated water into the creek approximately 1150 feet downstream of the stream head.
The Milford Creek Watershed is predominantly agricultural, including corn, soybean, and hay production along with some pasture and livestock (IDNR, 2007). Urban development and expansion are also prevalent in the watershed, with a significant increase in the last 20 years.
For the past two decades, surface water pollution waste load allocations have been established based on the framework of the Total Maximum Daily Load (TMDL) program within the U.S. Environmental Protection Agency and administered by the Iowa Department of Natural Resources (USEPA, 2000). A 2001 lawsuit against the U.S. Environmental Protection Agency resulted in a formal Consent Decree requiring the development of TMDLs for all impaired waters in Iowa, including lower Milford Creek (IDNR, 2007). Officially finalized in 2007, the Milford Creek Water Quality Improvement Plan, or TMDL, identifies phosphorus and dissolved oxygen as key contributors to macrophytes and creates conditions not supporting aquatic life (IDNR, 2007). The Iowa Great Lakes Sanitary District (IGLSD), surface runoff (particularly from urban land cover), and background/atmospheric sources were identified as the leading contributors of phosphorus, (IDNR, 2007). The six-mile run between the IGLSD facility and the downstream monitoring site for the TMDL includes storm sewers, unregulated discharge sites and modified land use over the past two decades.
Phosphorus in lake systems has been historically difficult to link to likely sources precisely and empirically. Estimations through statistical modeling provide the basis for generally relating local landscape conditions with water quality measurements (Yuan and Jones 2020; Schilling and Wolter 2009). Previous research on nutrient dynamics in Iowa waters indicate a considerable lack of precision in annual load prediction for both nitrate and total phosphorus, (Stenback et al. 2011). Additionally, relationships corresponding to urban landscapes have been especially difficult to identify, let al.one quantify. Causative agents can vary from sediment contamination, low dissolved oxygen, high toxicants, etc. to high flows, unstable stream beds and absence of habitat refuge areas (Pitt, 2002).
QUAL2K, a one-dimensional river and stream model provided the hydrologic model inputs for the initial TMDL (https://www.qual2k.com/) (IDNR, 2007). Nonpoint source load estimations for the TMDL were derived from the EUTROMOD water quality model (IDNR, 2007). EUTROMOD is a simple, spreadsheet-based collection of models developed by Ken Reckhow of Duke University to predict annual nutrient loading in lakes and reservoirs at the watershed scale (Hession et al., 2001; Reckhow et al., 1992). The model can simulate 12 land use categories, with two categories dedicated to urban land use (Reckhow et al., 1992). The model may lack adequate specificity for accurate outputs relevant to this study area.
Developed by the US Department of Agriculture Agricultural Research Service (ARS), the Soil and Water Assessment Tool (SWAT) model provides a broad estimation of pollutant load from sediment and nutrients sourced to surrounding agricultural landscapes (Arnold et al., 1998; Arnold and Fohrer 2005; Gassman et al., 2007). Because land use within the Milford Creek watershed includes a mix of both urban and rural land use, the model may not adequately account for potential impacts within incorporated communities.
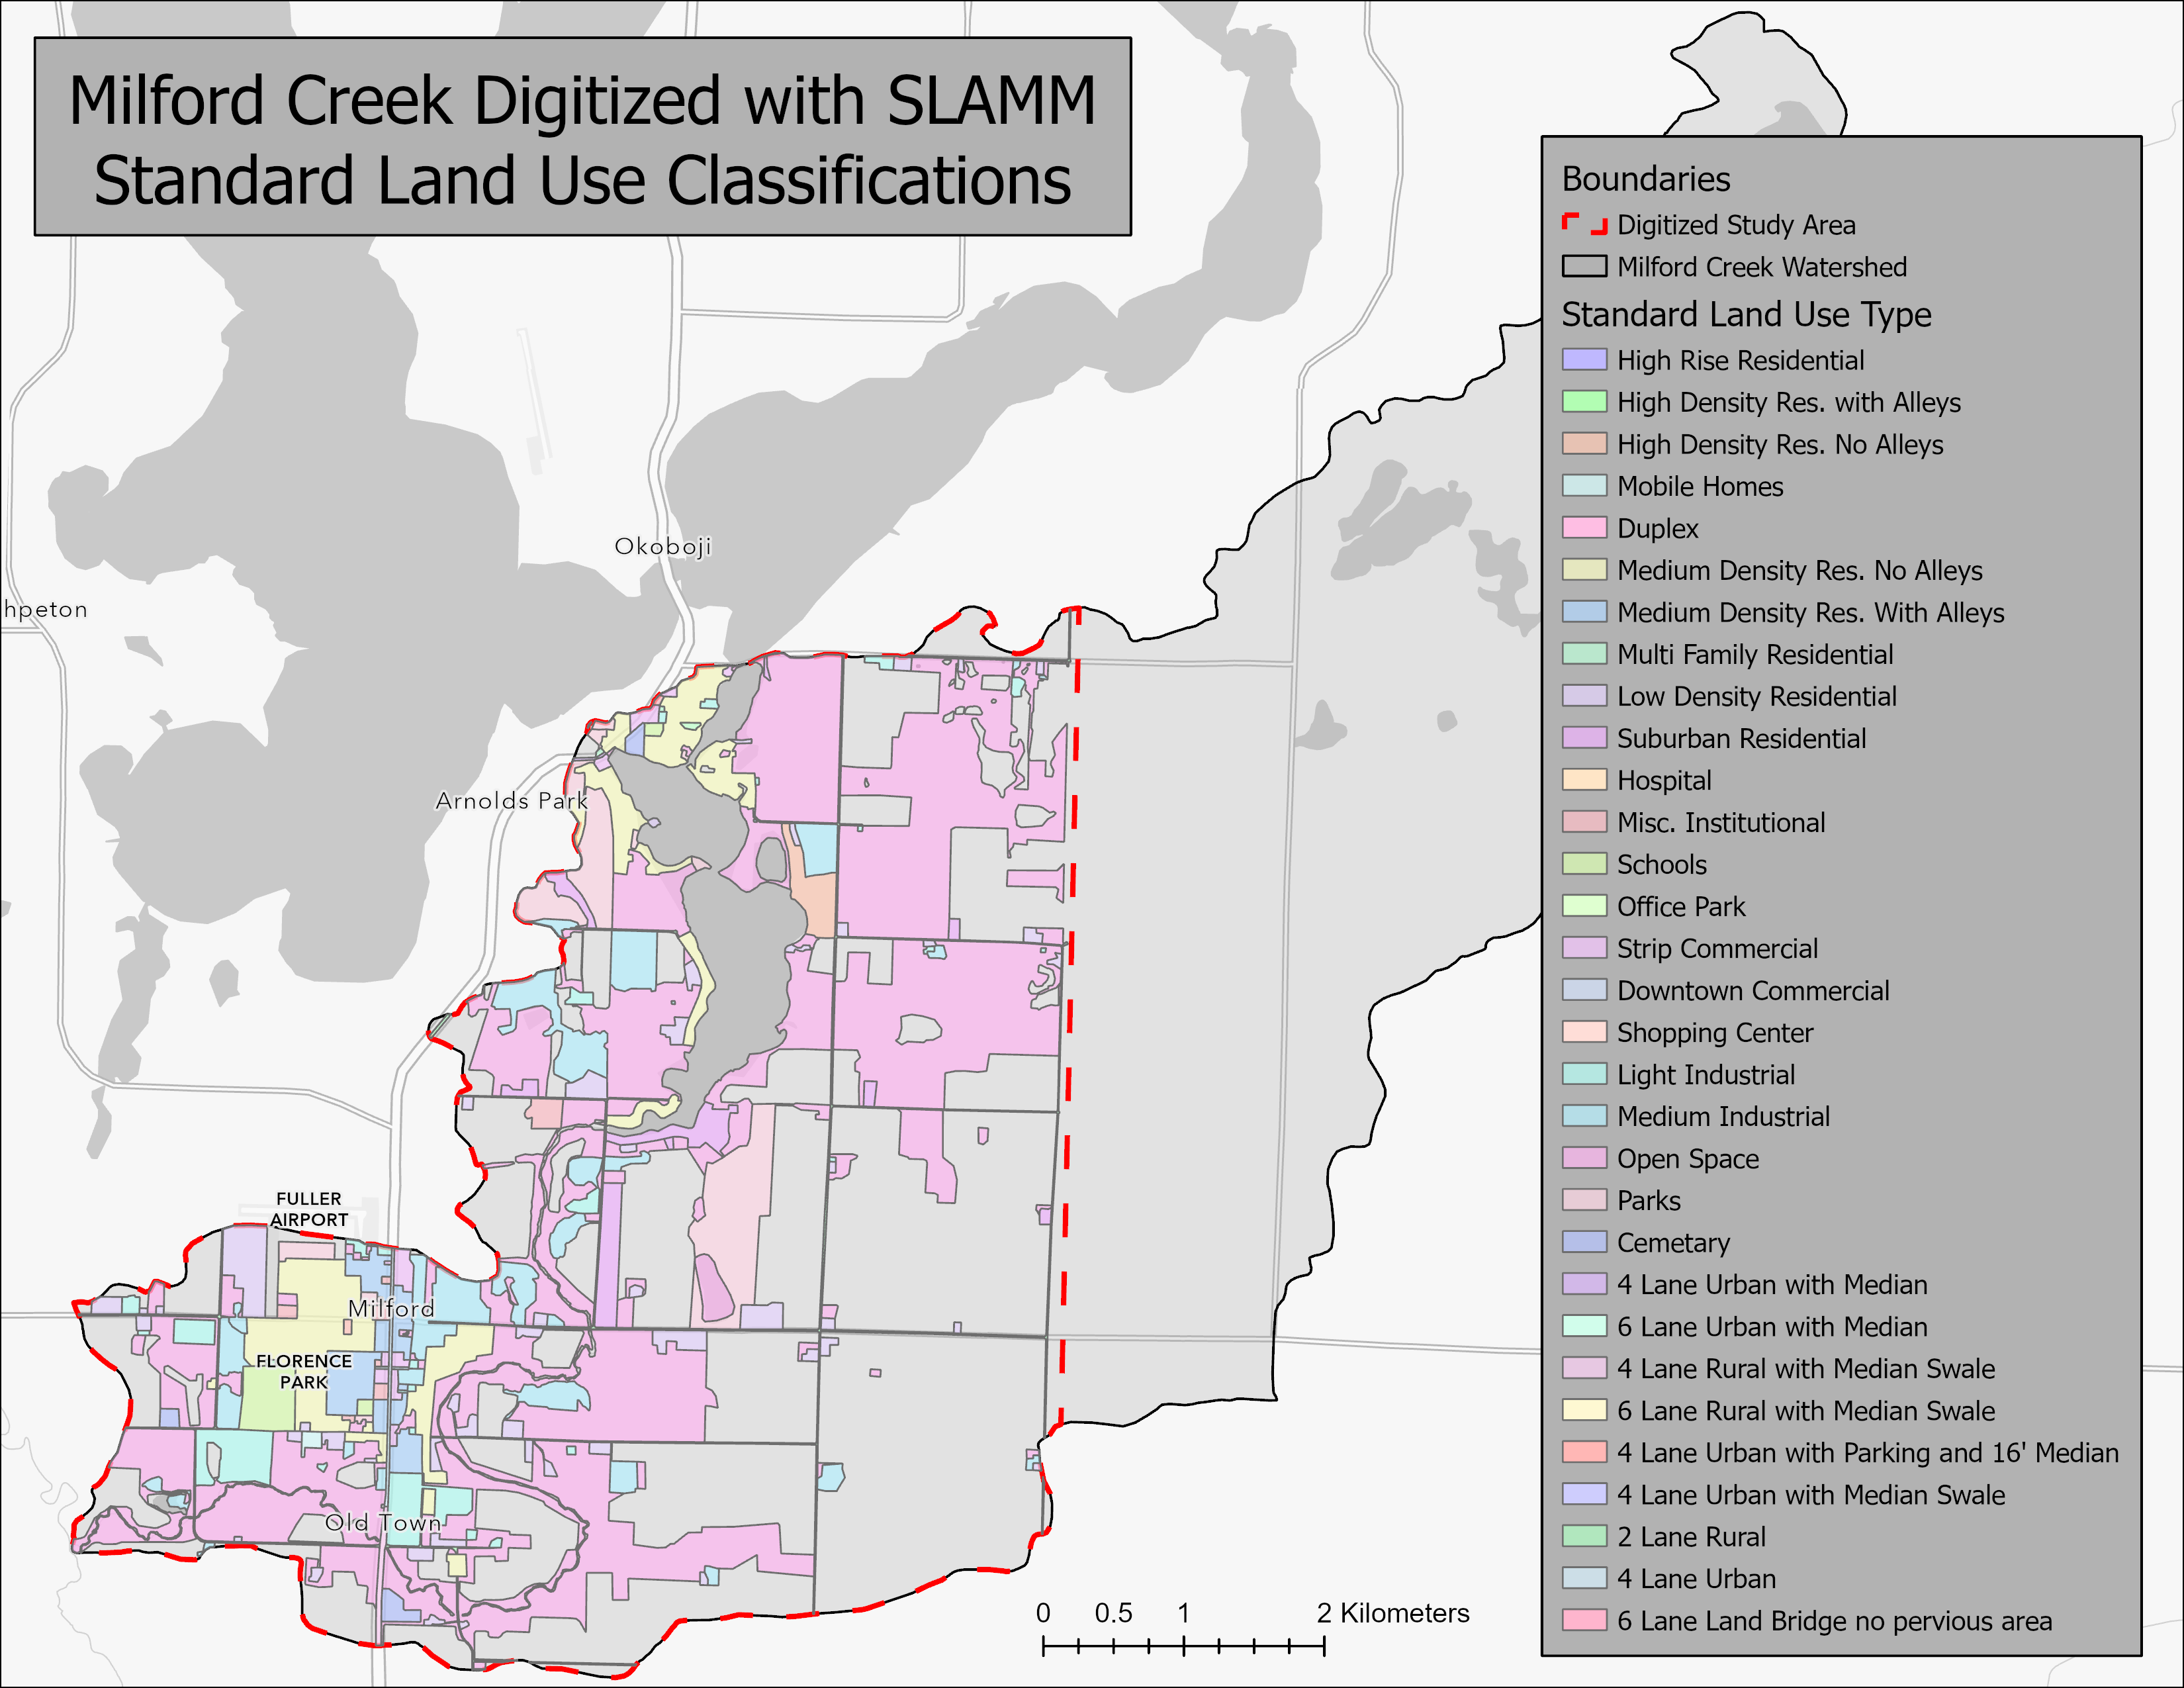
WinSLAMM, developed by PV & Associates, LLC, is an experimentally derived urban stormwater quality model that evaluates runoff volume and pollution loading at the source area level (PV & Associates). Data from the model can be used to determine how and where stormwater control measures should be implemented to meet objectives (PV & Associates). The ArcSLAMM interface provides a workflow to define source area and catchment data to be evaluated with WinSLAMM. There are 31 standard land uses that urban areas can be classified as. This model is based on observational data instead of pure theory and has proven reliable in predicting changes in pollutant loads in response to stormwater control practices (Yuan et al., 2020). This study will combine SWAT and SLAMM modeling data along with a digital elevation model to predict phosphorus contributions from nonpoint source areas more accurately.
Data
General land use information was derived from the Multi-Resolution Land Characteristics Consortium's National Land Cover Dataset (NLCD) for the years 2001, 2004, 2006, 2008, 2011, 2013, 2016, and 2019. This provided data for calculating and visualizing changes in land use from 2001-2019. Classification of specific urban land uses was developed for this project through the ArcSLAMM interface in ArcGIS Pro with reference photos from Iowa State University’s Iowa Geographic Map Server in conjunction with NLCD data. Digital elevation models were derived from light detection and ranging (LiDAR) data from the University of Northern Iowa’s GeoTREE Iowa LiDAR Mapping Project. Flowline and watershed boundary data came from the U.S. Geological Survey’s National Hydrography dataset (NHD). Soil classification data came from the National Resources Conservation Service’s Soil Survey Geographic database (SSURGO).
Data Limitations and Contingencies
The TMDL was based on modeling data from 2004 and sample data from 2005. Modeling data was based on a topographically derived study area. With a LiDAR-derived DEM, we aim to provide more accurate results. The EUTROMOD model used in 2004 is designed for predicting nutrient loading conditions in lakes and reservoirs, while the goal of the TMDL is to evaluate stream conditions (Reckhow et al., 1992). Each land use is evaluated as a homogenous unit, applying the same physical characteristics to each area based on the defined land use (Hession et al., 2001). Original modeling grouped all urban areas into only two urban land cover types, neglecting complex variation within urban environments. Because EUTROMOD estimates annual loading, proper calibration requires many years (Hession et al., 2001). However, EUTROMOD input values only included 2002 data in the TMDL analysis (IDNR, 2007). With the combination of SLAMM and SWAT, the modeled outputs will be a more accurate representation of phosphorus loading from nonpoint sources.
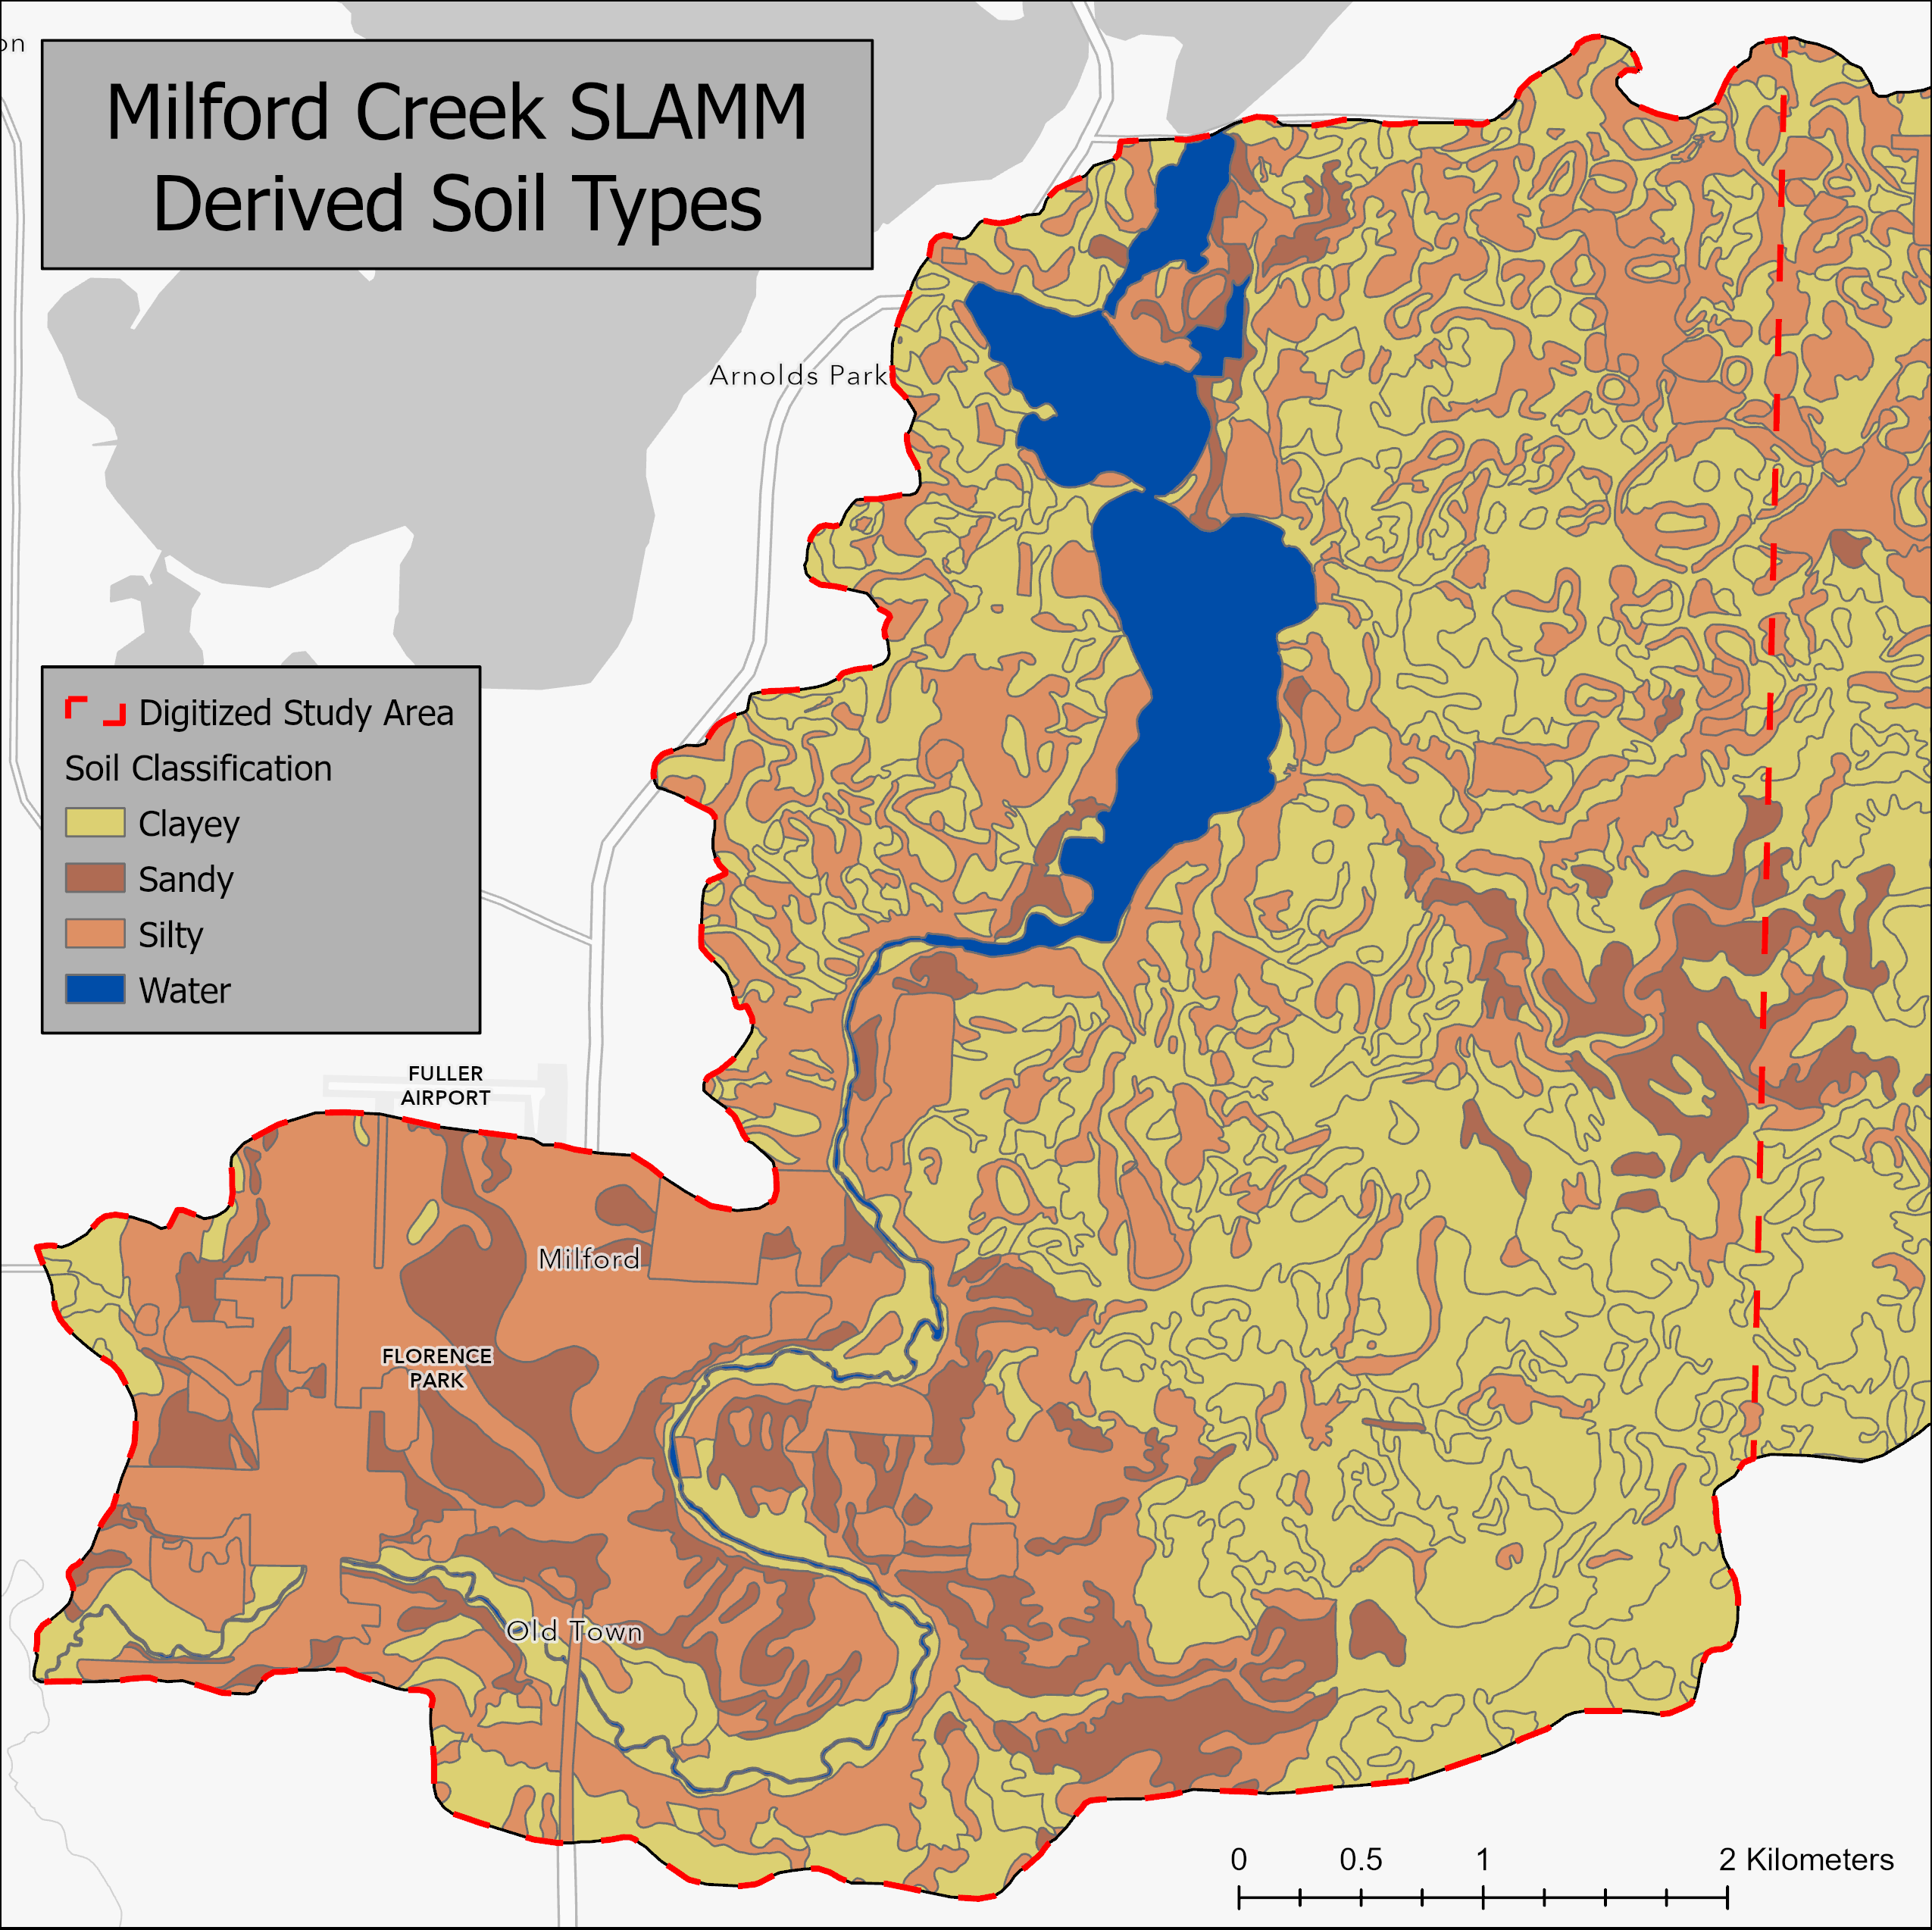
One issue during ArcSLAMM preprocessing included the failure of a handful of polygons to derive a soil type due to a lack of data. These polygons with null soil types were manually reclassified as “Silty,” based on local site knowledge and verification through personal communication (Anderson, 2022).
Methods
Temporal land use analysis of the Milford Creek watershed was conducted with NLCD raster images in ArcGIS Pro. Raster data was clipped to the size of the study watershed. To reduce the number of individual land classes, they were reclassified into three broader categories: water, barren land, forest & scrub, wetland; hay/pasture, cultivated crop; urban.
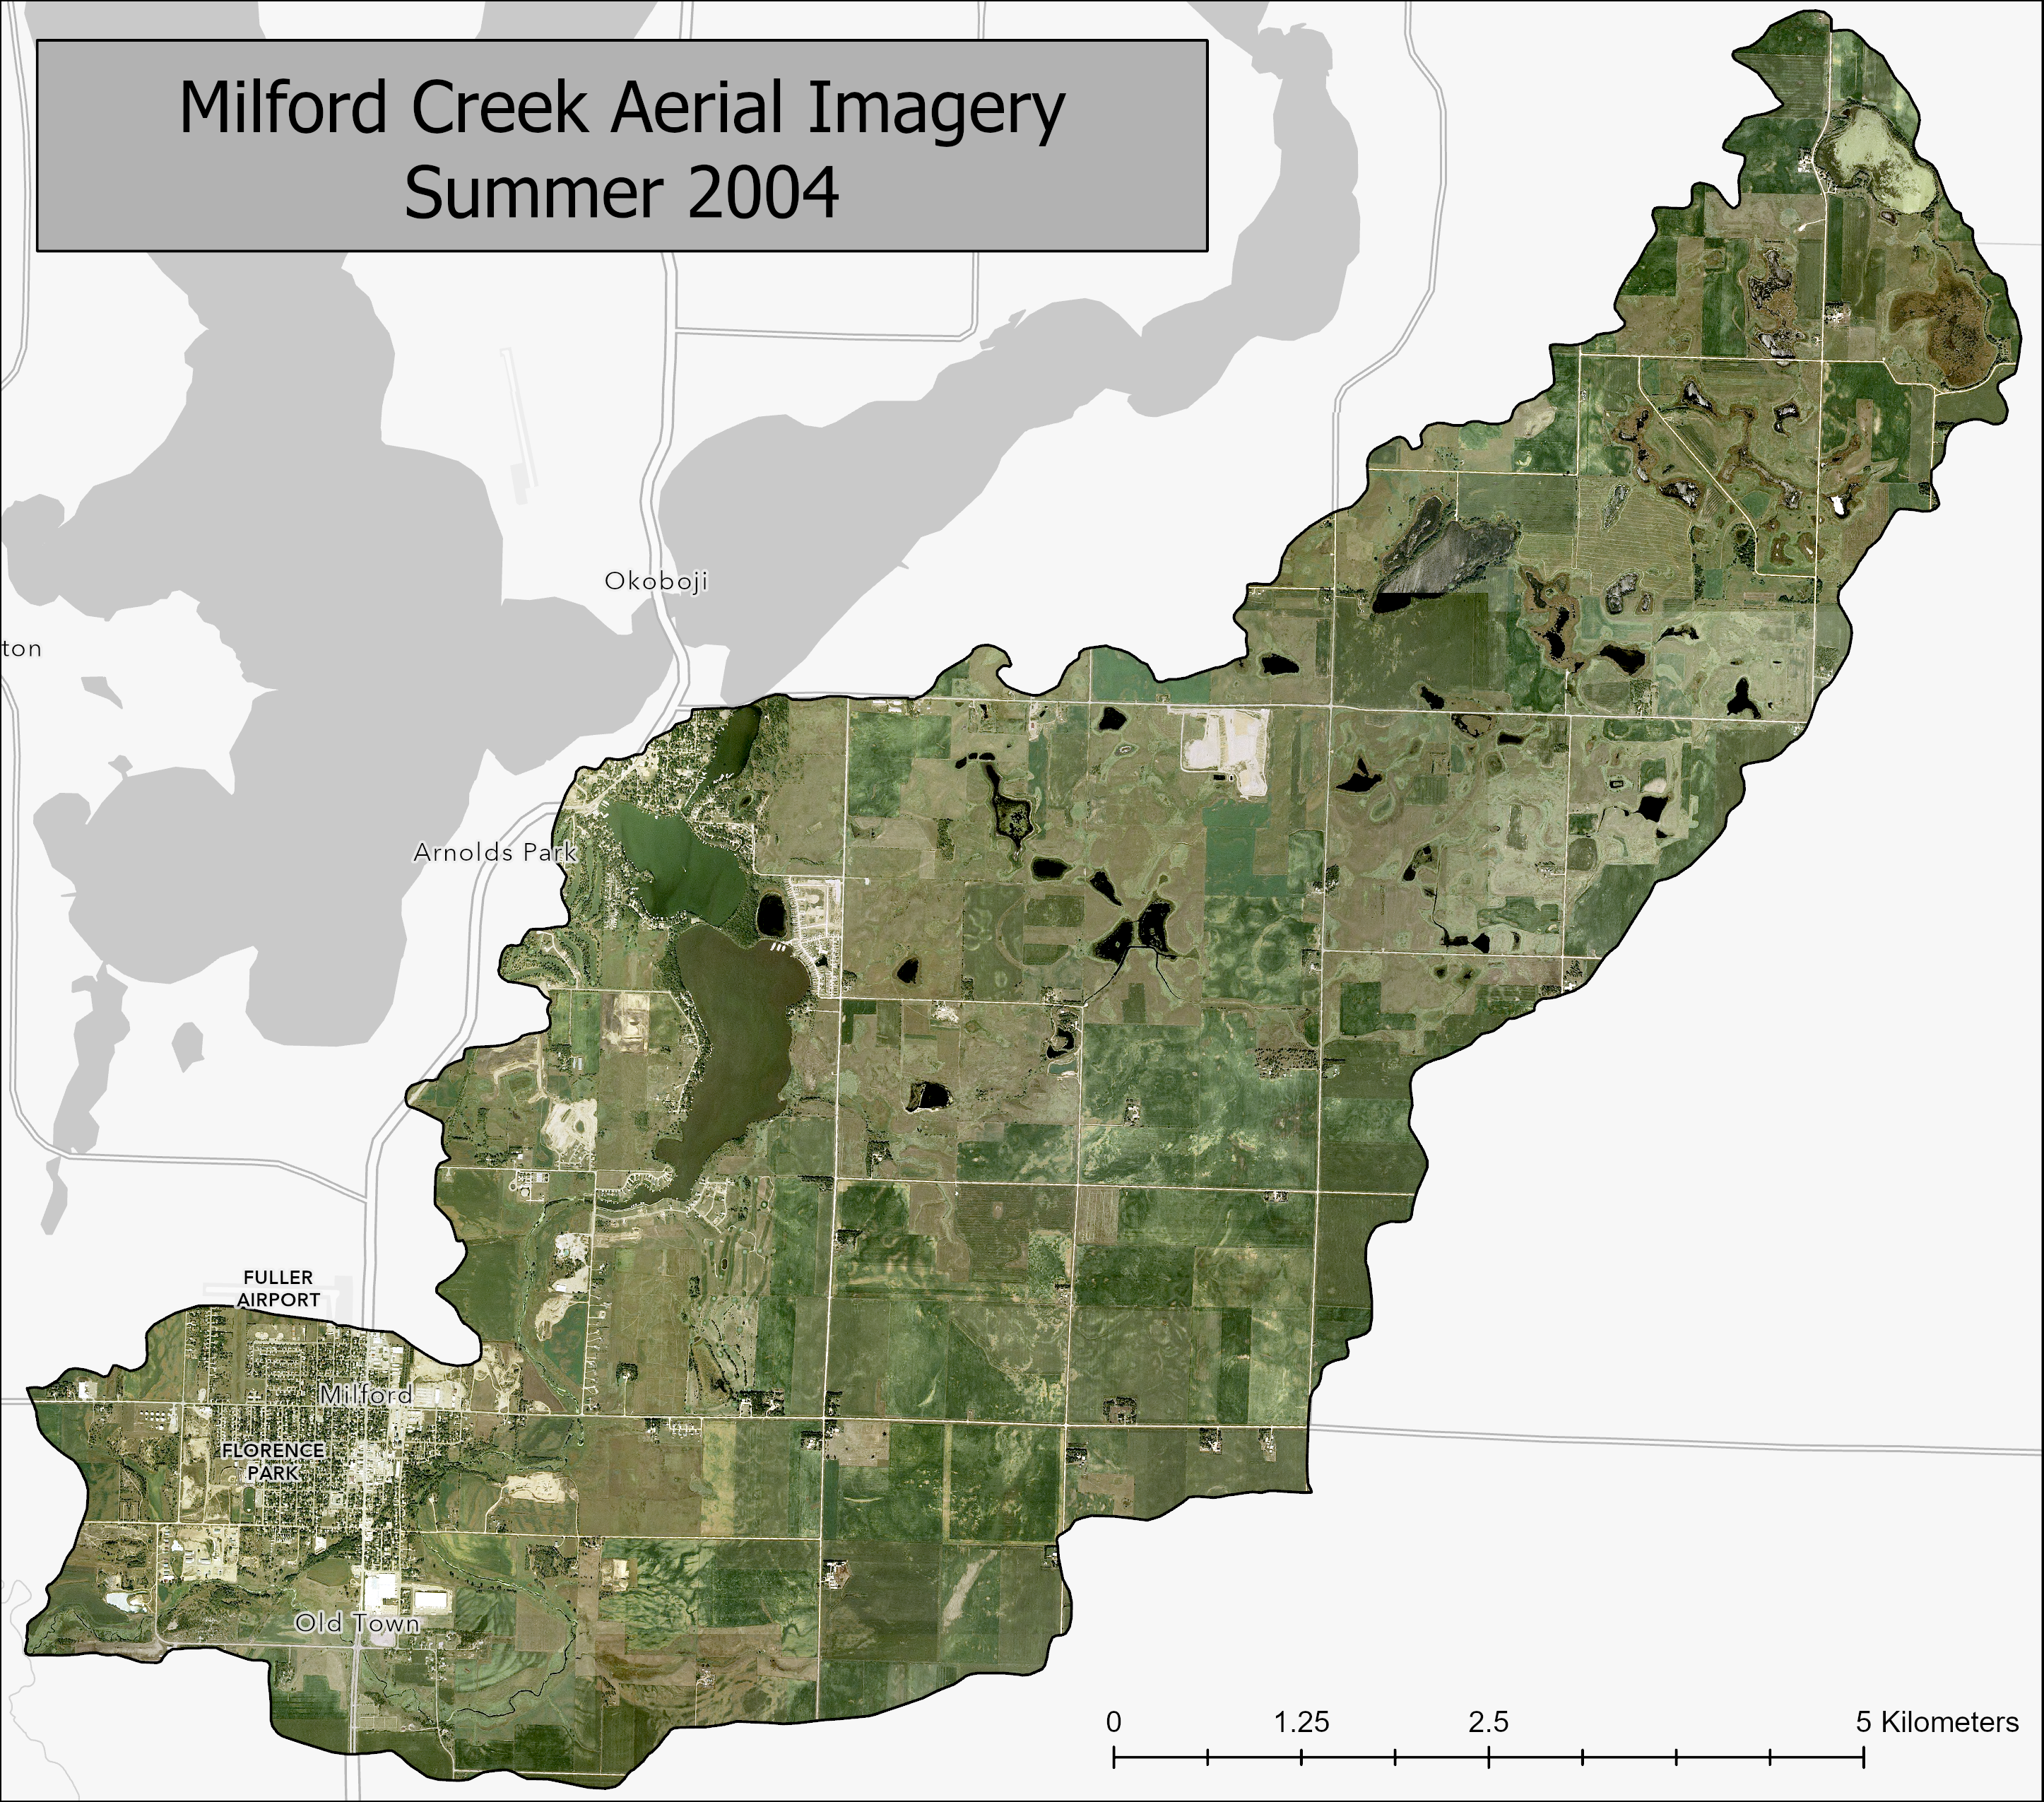
Manual digitizing polygons for urban land use comprises the majority of the work for modeling phosphorus output using the SLAMM model. This was done in ArcGIS Pro using 2004 and 2021 aerial imagery. 2004 imagery was significantly lower resolution than 2021 imagery, so 2021 imagery was used to enhance polygon accuracy while classifications were determined based on 2004 imagery. Some questionable areas were verified with Milford Mayor Steve Anderson. Urban land uses were classified into 1 of 31 possible standard land uses (SLUs) for SLAMM evaluation, including different road, residential, undeveloped, industrial, commercial, institutional, and recreational land types. Agricultural land and open water were not included in SLAMM digitization. The completed digitization is comprised of 344 individual polygons over the southwestern half of the watershed.
SSURGO soil classification data was clipped down to the study watershed. ArcSLAMM’s “Derive Soil Type from SSURGO” tool was used to generate a new feature class of soil polygons compliant with WinSLAMM input values based on soil content. A generalized soil classification system was developed as part of the ArcSLAMM tool. The GeoInformatics Training Research Education and Extension (GeoTREE) Center at the University of Northern Iowa (UNI GeoTREE Center) developed this tool as a partnership with PV and Associates to enable more systematic digitization of urban watersheds using GIS-based tools (“Winslamm”). New polygons were categorized as “Silty”, “Clayey”, or “Sandy”.
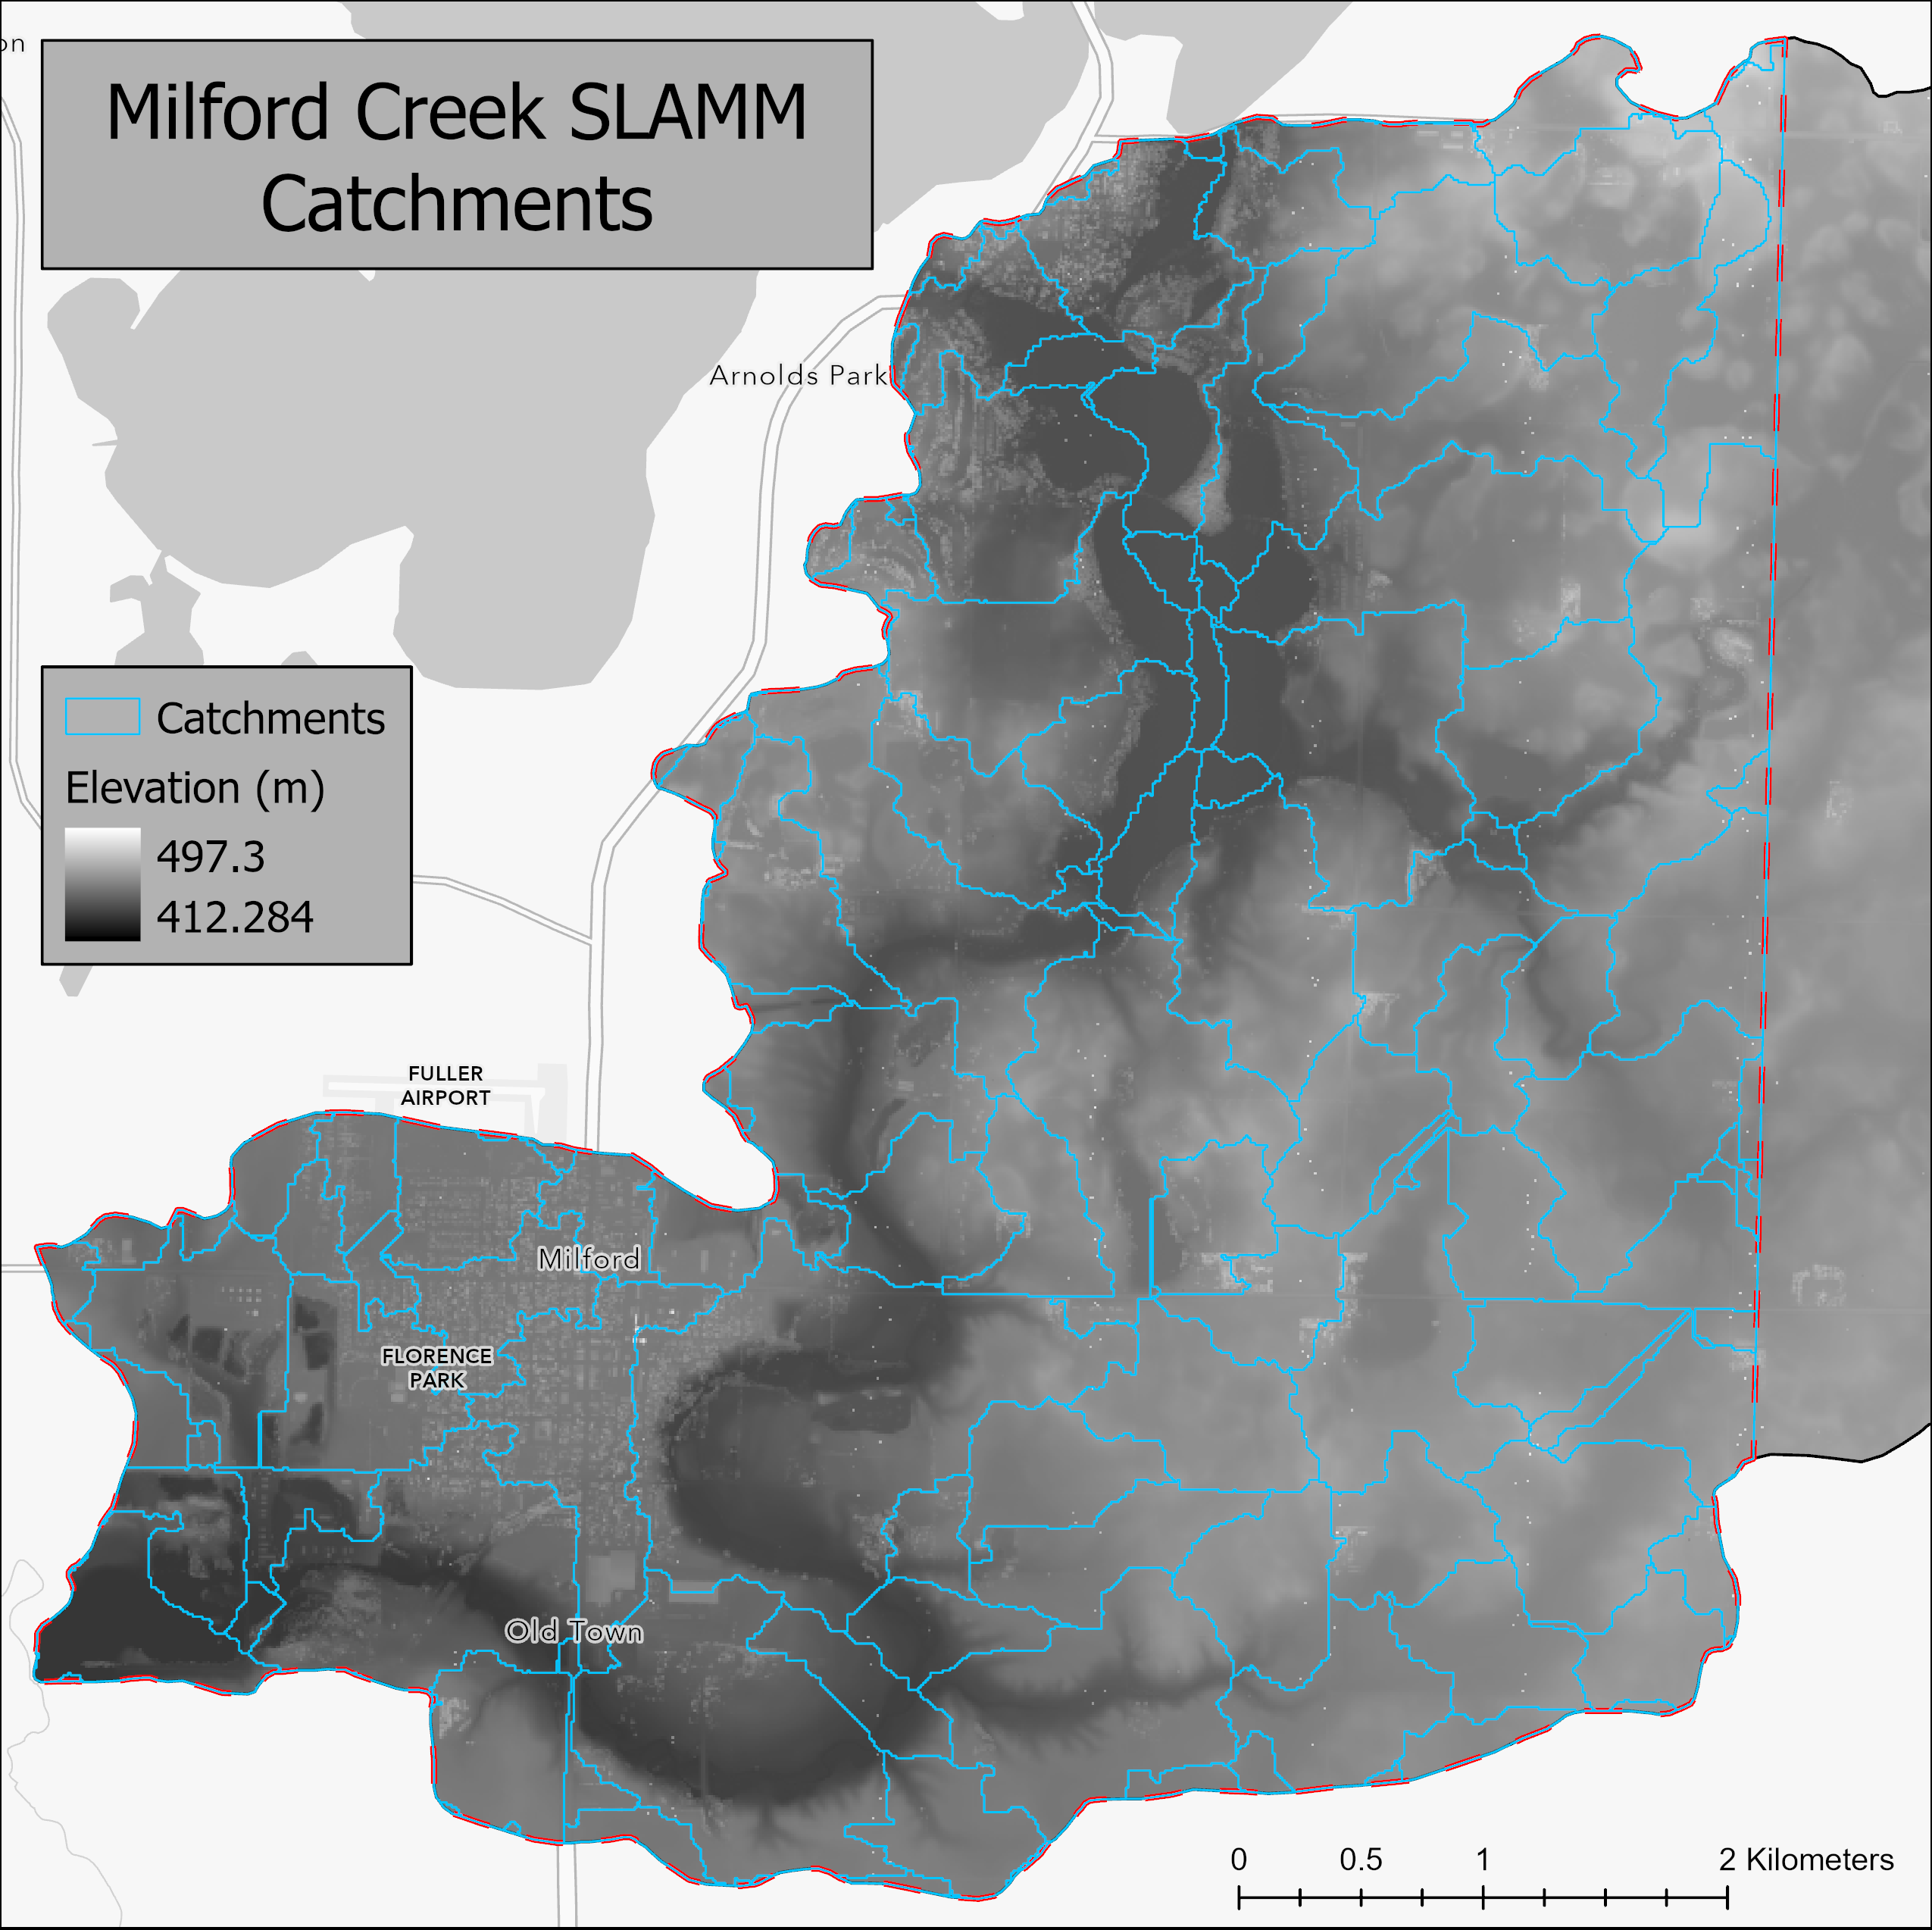
Land uses had to be grouped into runoff catchment areas based on high-resolution LiDAR data. LiDAR data was transformed into a digital elevation model (DEM) with ArcGIS Pro’s “LAS dataset to Raster” tool. 33 separate LAS datasets were rasterized and mosaicked to produce the DEM, which was then burned in with NHD flowlines to eliminate artificial blockages in the DEM with the “Hydrologically Enforce Digitial Elevation Model (DEM)” ArcSLAMM tool. From this processed DEM, 126 catchments were generated for the study area with ArcSLAMM’s “Catchment Delineation for Stream Segments” tool.
Standard land use classification, soil classification, and catchment delineation features were then combined with the “Intersect Catchments with WinSLAMM Detailed Source Areas” ArcSLAMM tool.
Significance of Results
The Iowa Great Lakes region is one of the most popular tourist destinations in Iowa due to the abundance of on-water recreation opportunities. Dickinson County, which houses the lakes, is ranked 39th most populous in Iowa (“Iowa Counties by Population.”) while ranking 9th in domestic travel expenditures (“Economic Impact of Travel”). Because the Iowa Great Lakes region’s tourism-dominated economy is dependent on lake health, preserving water quality is essential.
The point source pollution of the IGLSD’s effluent has been identified as the primary cause of phosphorus loading in Milford Creek. The burden of improving stream health has fallen on the IGLSD, requiring significant WWTP upgrades. The cost of these upgrades will be passed on to the taxpayers of Milford. This study seeks to determine the degree to which the IGLSD is responsible for phosphorus levels, taking into consideration the phosphorus contribution by urban land uses. Making an effective improvement in stream health at the lowest cost requires complete and accurate data.
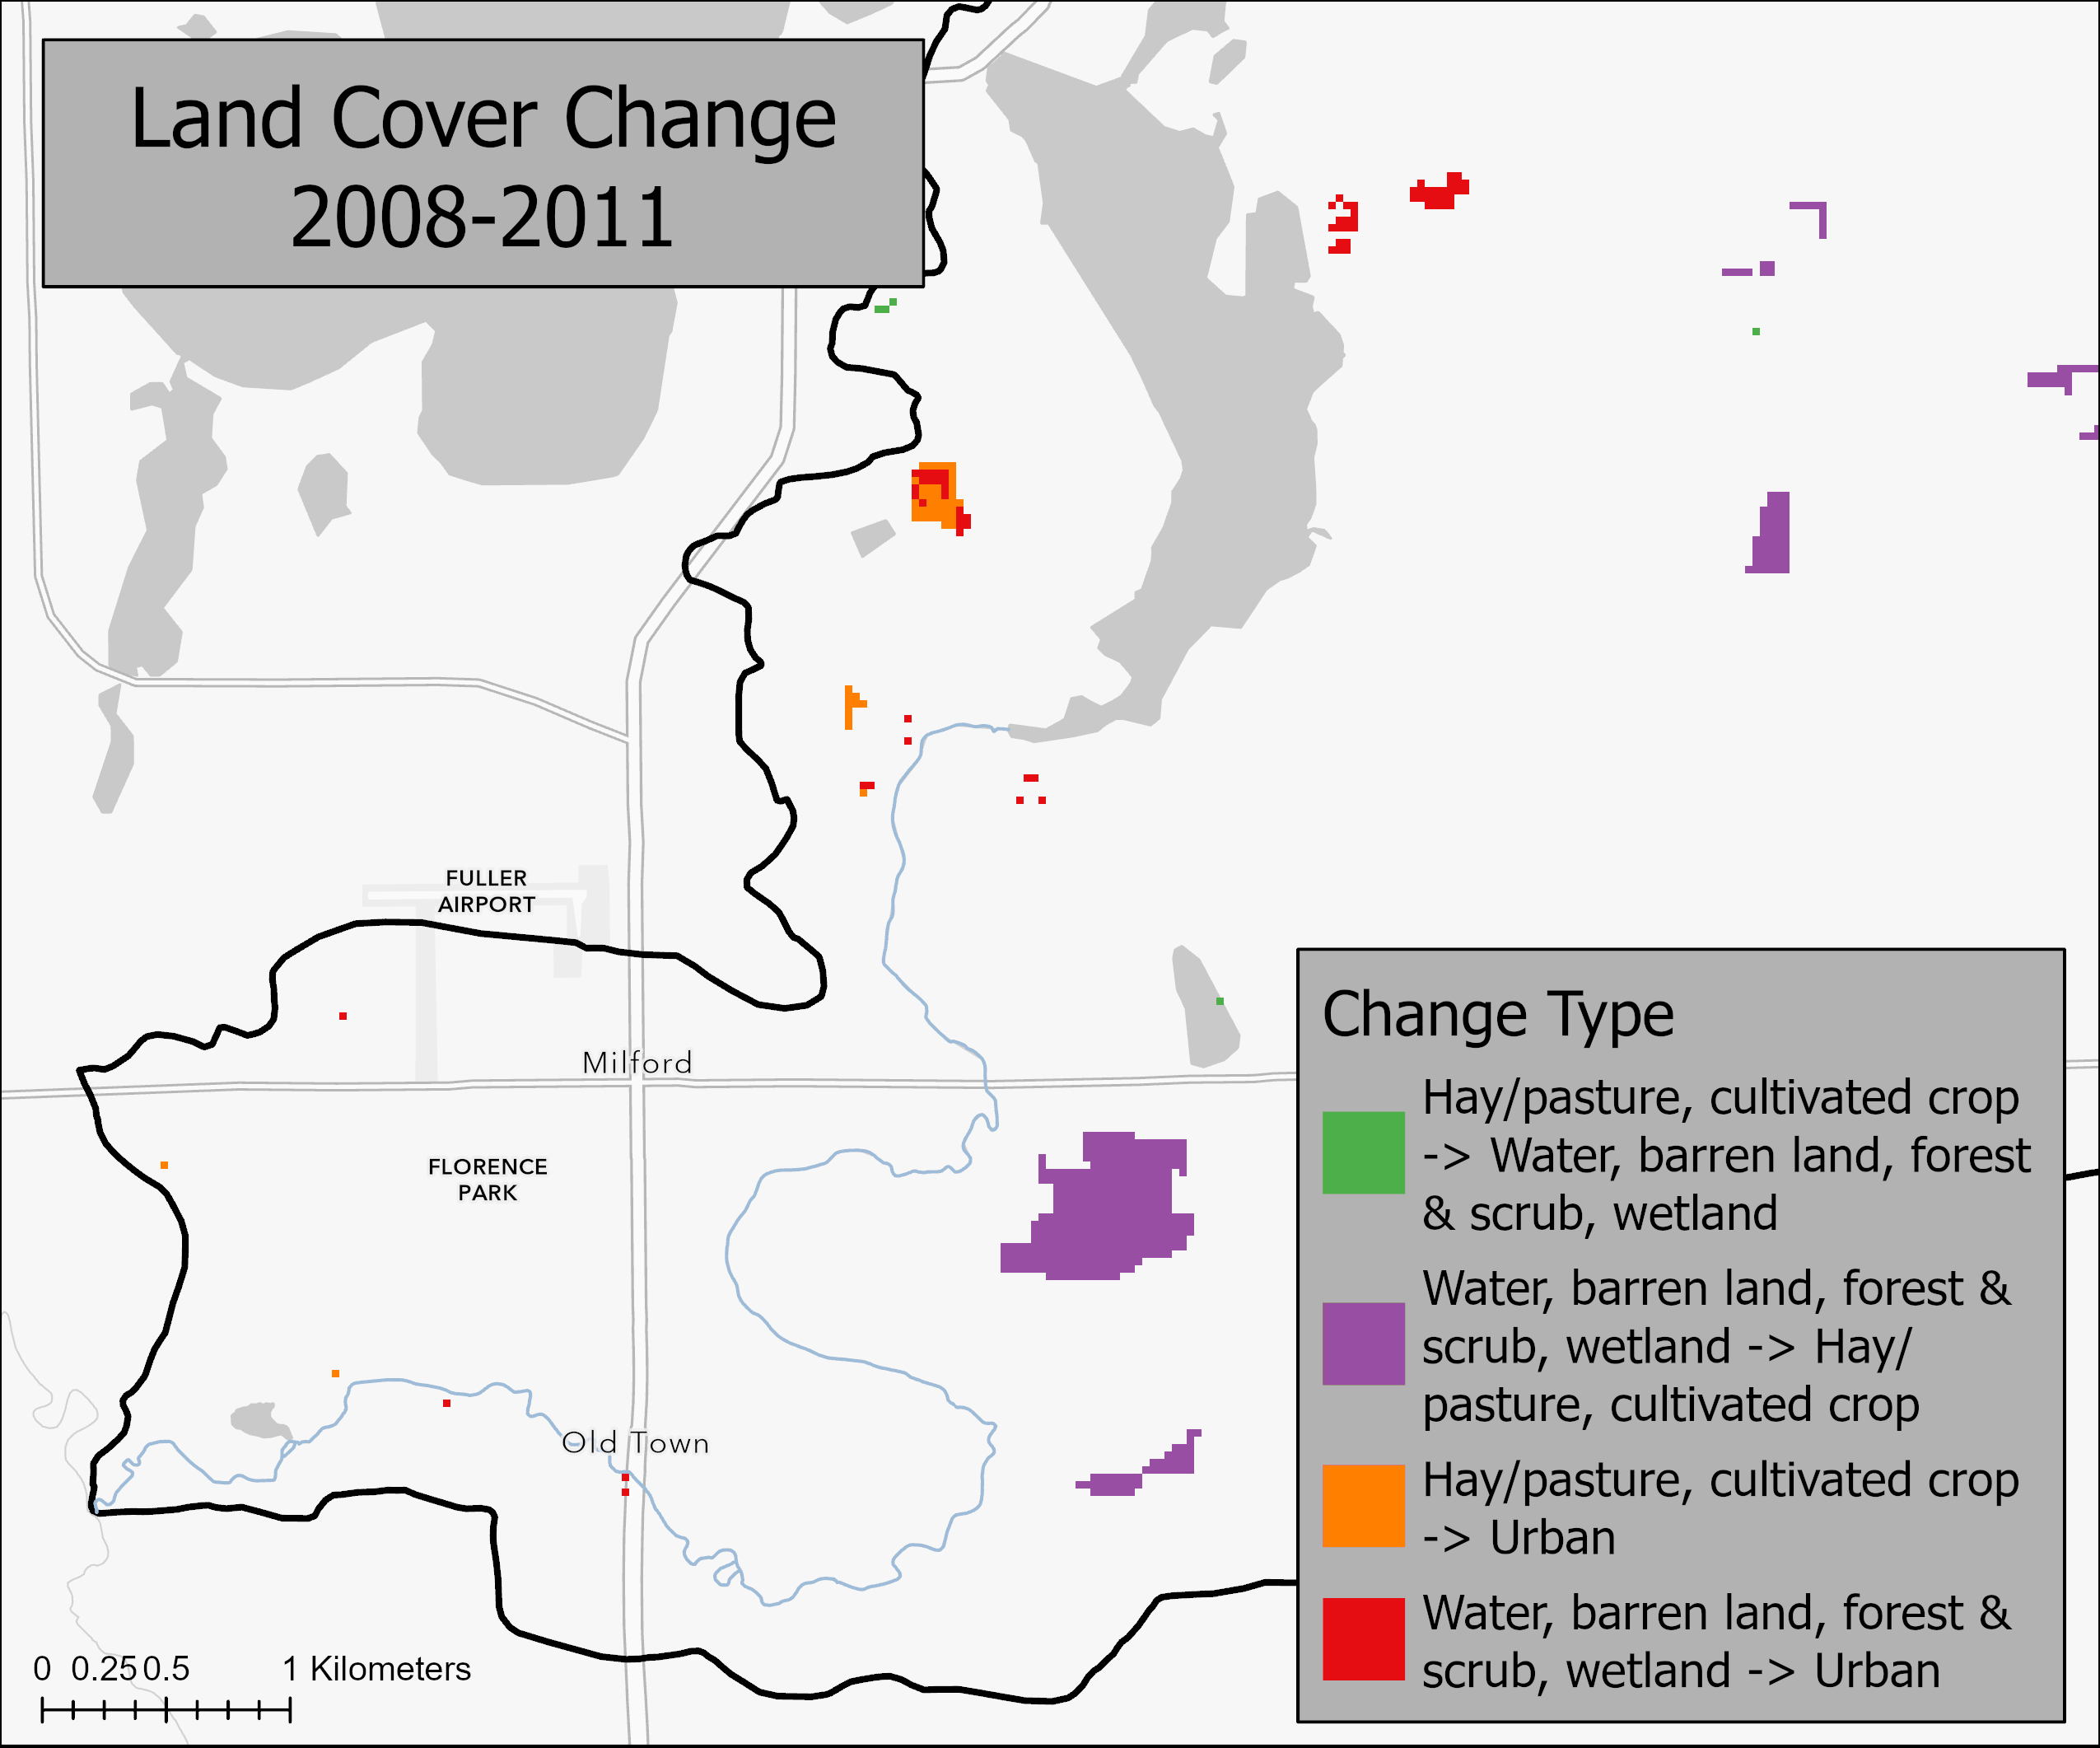
Change in Land Use: Milford Creek 2001-2019
Initial Conclusions
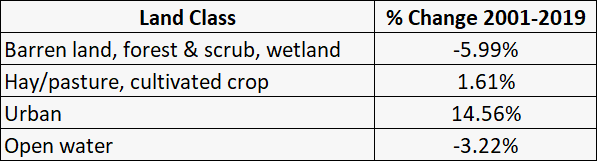
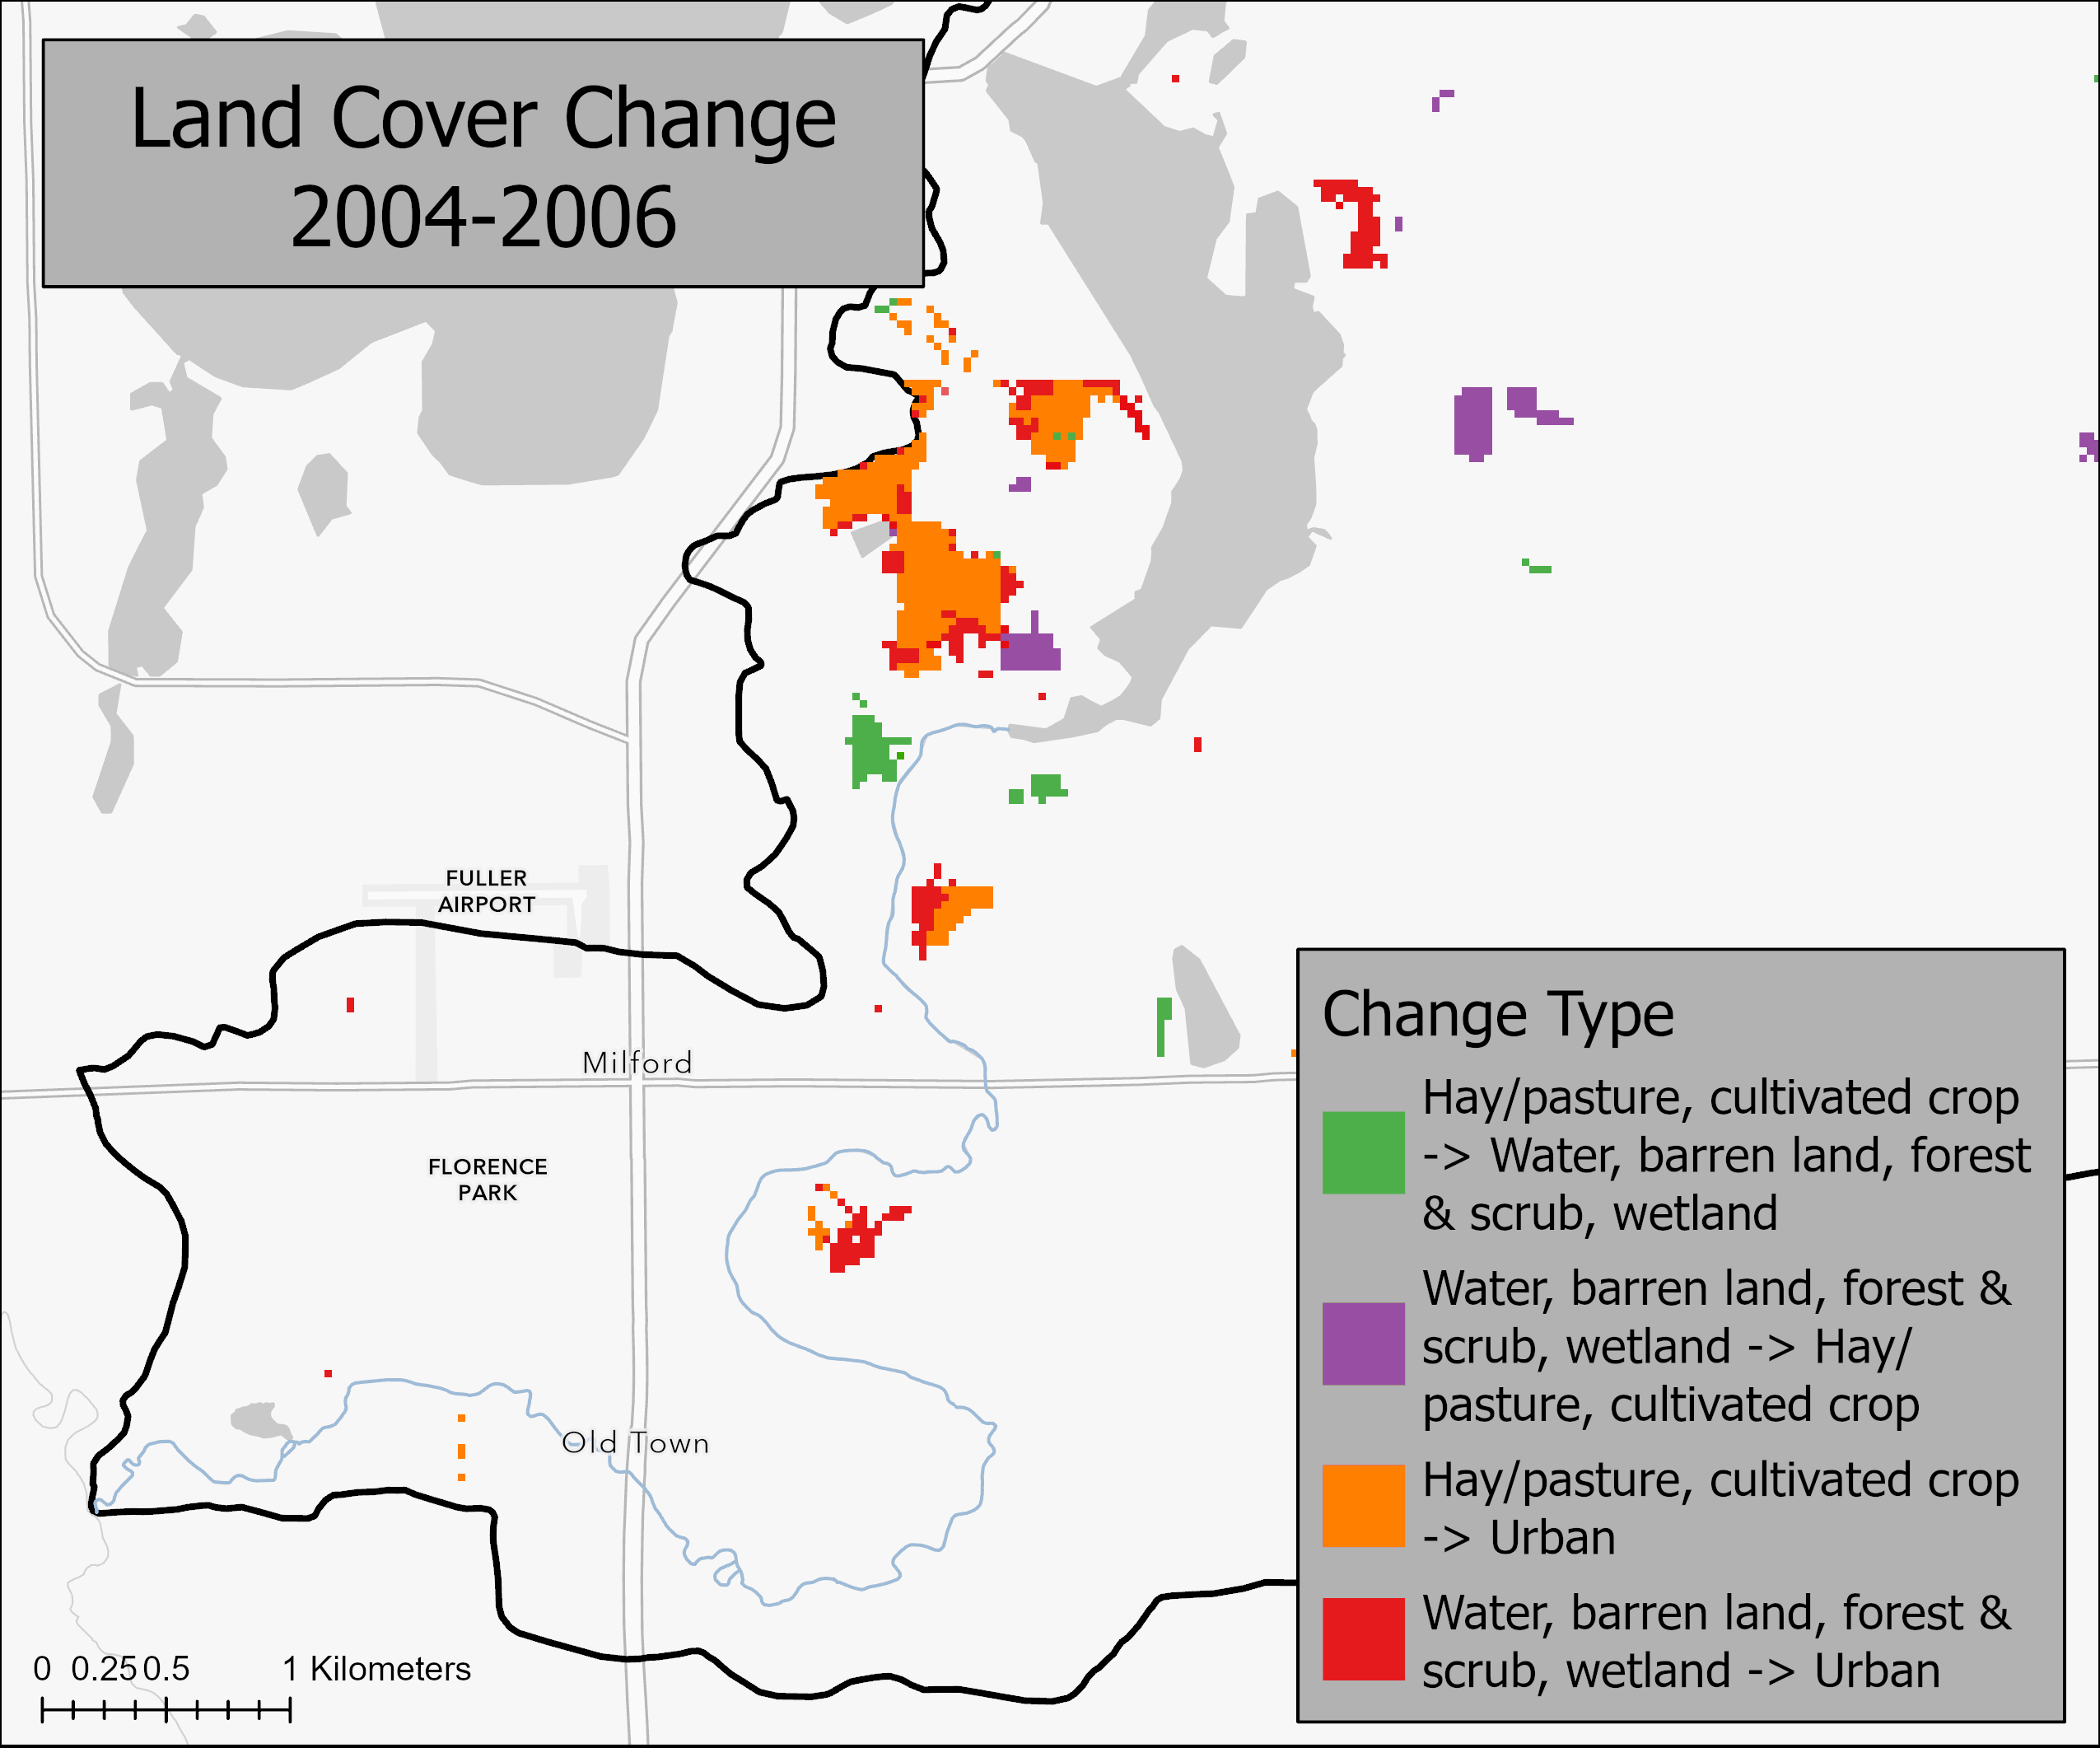
Between 2001 and 2019, the undeveloped land class saw a 5.99% reduction in area, while agricultural land use and urban coverage grew by 1.61% and 14.56%, respectively. Roughly 2/3 of the increase in urbanization took place between 2004 and 2006 and was concentrated south and west of Lower Gar Lake. Most of the increase in agricultural land use was between 2008 and 2011, likely as a result of land moving back from the Conservation Reserve Program (CRP) into crop production.
The detail involved in SLAMM modeling is indicative of the difference in accuracy of the TMDL data. This study includes a larger extent of digitization, with ~8,000 acres of the ~15,000 acres assessed. Nearly 12% of the Milford Creek watershed was classified as urban in the NLCD dataset, which was not all accounted for in previous modeling. Urban land use is a fundamentally different phosphorus source area than rural farmland, requiring its own set of modeling parameters. We expect the results of the SLAMM model to be comparatively different to original modeling.
Next Steps
Once data preprocessing is complete, the input files will be run through the SLAMM model to obtain predicted phosphorus contributions from urban areas for 2004. The necessary preprocessing steps to run the SWAT model will also be applied to agricultural areas, which were not evaluated with SLAMM. The results of these models will be compared to give a more accurate assessment of the 2004 stream conditions the TMDL were based on.
Further stream sampling is ongoing, and a comparison between present data and 2004 data will provide insight into the effects of land use changes over the last two decades. A second SLAMM and SWAT combination analysis for 2019 land cover will be conducted for temporal modeling output comparisons.
Acknowledgements
Mentor: Rebecca L. Kauten, PhD, Scientist in Residence, Iowa Lakeside Laboratory Regents Resource Center. Special thanks to Steve Anderson, John DeGroote and John Voorhees for their assistance with this project.
References
Anderson, S. Iowa Great Lakes Sanitary District Superintendent. Personal communication. March 9, 2022.
Arnold JG, Fohrer N (2005) SWAT2000: current capabilities and research opportunities in applied watershed modeling. Hydrological Processes 19:563–572.
Arnold JG, Srinivasan R, Muttiah RS, Williams JR (1998) Large area hydrologic modeling assessment: Part 1 Model development. Journal of the American Water Resources Association 34(1): 73–89.
“The Economic Impact of Travel on Iowa Counties 2019.” Travel Iowa. U.S. Travel Association. Accessed March 28, 2022. https://www.traveliowa.com/userdocs/pages/IA_2019_Report_Aug._28,_2020.pdf.
Gassman PW, Reyes M, Green CH, Arnold JG (2007) The soil and water assessment tool: historical development, applications, and future directions. Transactions of the ASABE 50(4):1211–1250.
Hession, W. Cully, Maeve McBride, John E. Parsons, and Kenneth H. Reckhow. "Evaluation of the Water Quality Model EUTROMOD1." Editors: John E. Parsons, Daniel L. Thomas, Rodney L. Huffman (2001): 63.
“Iowa Counties by Population.” Iowa Demographics. Cubit. Accessed March 28, 2022. https://www.iowa-demographics.com/counties_by_population.
Iowa Department of Natural Resources (IDNR). 2007. pp. 10-19. Water Quality Improvement Plan for Milford Creek Dickinson County, Iowa. Iowa Department of Natural Resources, Des Moines, IA 50319.
Iowa Geographic Map Server. Iowa State University Geographic Information Systems Support & Research Facility. Accessed March 28, 2022. https://ortho.gis.iastate.edu/.
“Iowa LiDAR Mapping Project.” GeoTREE Center. GeoInformatics Training Research Education and Extension (GeoTREE). Accessed March 28, 2022. http://www.geotree.uni.edu/en/extension/iowa-lidar-mapping-project/.
National Hydrography Dataset. U.S. Geological Survey. Accessed March 28, 2022. https://www.usgs.gov/national-hydrography/national-hydrography-dataset.
Nauman, Rich. “SSURGO Soil Data Updated and Upgraded for 2019.” ArcGIS Blog. ESRI, July 18, 2019. https://www.esri.com/arcgis-blog/products/arcgis-living-atlas/natural-resources/whats-new-with-soils-in-the-living-atlas/.
“NLCD Land Cover (CONUS) All Years.” Multi-Resolution Land Characteristics (MRLC) Consortium. Accessed March 28, 2022. https://www.mrlc.gov/data/nlcd-land-cover-conus-all-years.
Pitt, R. (2002) “Receiving Water Impacts Associated with Urban Runoff.” University of Alabama. Edited by Hoffman, et al. for Handbook of Ecotoxicology. 2nd Edition. CRC-Lewis. Boca Raton, FL.
Reckhow, K.H., S. Coffey, M.H. Henning, K. Smith, and R. Banting. 1992. “EUTROMOD: technical guidance and spreadsheet models for nutrient loading and lake eutrophication.” Draft report. Durham, NC: School of the Environment, Duke University.
Schilling, Keith E., and Calvin F. Wolter. 2009. "Modeling Nitrate-Nitrogen Load Reduction Strategies for the Des Moines River, Iowa Using SWAT." Environmental Management 44 (4):671-682. doi: 10.1007/s00267-009-9364-y.
Stenback, Greg A., William G. Crumpton, Keith E. Schilling, and Matthew J. Helmers. 2011. "Rating curve estimation of nutrient loads in Iowa rivers." J HYDROL 396 (1):158-169. doi: 10.1016/j.jhydrol.2010.11.006.
US Environmental Protection Agency, 2000. Total Maximum Daily Load (TMDL) Program. Rep. EPA841-F-00-009, Washington, DC.
“Winslamm and Windetpond by PV & Associates.” WinSLAMM and WinDETPOND by PV & Associates. PV & Associates, LLC. Accessed March 28, 2022. http://www.winslamm.com/.
Yuan, Lester L., and John R. Jones. 2020. "Rethinking phosphorus–chlorophyll relationships in lakes." Limnol Oceanogr 65 (8):1847-1857. doi: 10.1002/lno.11422.
Yuan, Lifeng, Tadesse Sinshaw, and Kenneth J. Forshay. 2020. "Review of Watershed-Scale Water Quality and Nonpoint Source Pollution Models" Geosciences 10, no. 1: 25. https://doi.org/10.3390/geosciences10010025