Workshop GeoVisualization
Introduction
Scales
Scales are a mapping from inputs to outputs. That is, a scale is a function that takes an abstract value and returns a visual value. A simple example is using two scales X and Y to create a scatterplot. X and Y each takes arbitrary values and map them to a dimension (usually from 0 to chart width).
 |
Setting scales:
d3.tsv('data/' + scale_f, function(data) {
  // look at the data
  //console.log(data);

  // Convert the attributes to nums
  data.forEach(function(d) {
    d.close = +d.close;
    d.date = parse_time(d.date);
    return d;
  });

  // Use D3's scales
	// Numeric
	var scl_linear = d3.scaleLinear().range([0, 200]);
  scl_linear.domain( // Linear only needs the min/max
    [d3.min(data, function(d) { return d.close; }),
    d3.max(data, function(d) { return d.close; })]
  );
  // Time
  var scl_time = d3.scaleTime().range([0, 200]);
  scl_time.domain(  // Same with time
    [d3.min(data, function(d) { return d.date; }),
    d3.max(data, function(d) { return d.date; })]
  );
});
Above scales mapped as axes:
Proportional Symbol Map
Choropleth
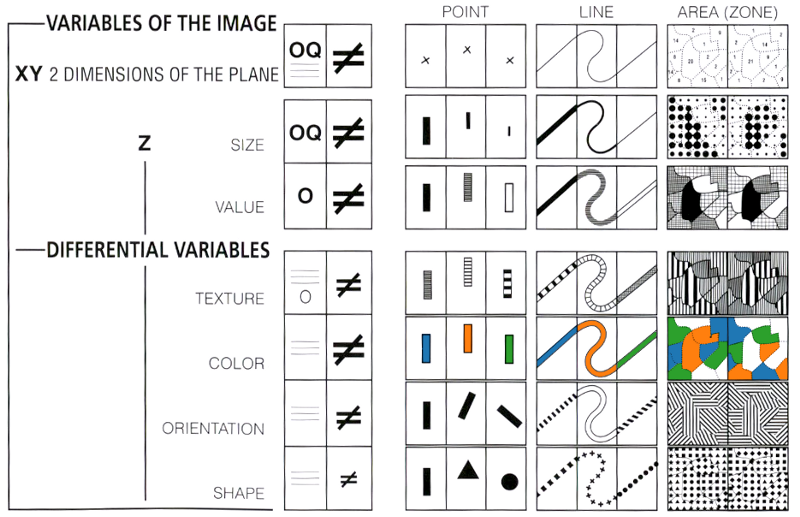
This mapping method uses color to encode polygon values. It employs a scale to assign a visual variable, in this case a HEX color value such as #000000. Example choropleth.